Last Updated: May 2026
Introduction
When most people start learning SQL, they usually come across the same type of tutorials everywhere.
Almost every website teaches:
- student database examples
- employee salary tables
- random company records
- textbook-based queries
At first, those examples help in understanding syntax. But the moment you enter a real reporting job, things look completely different.
Nobody in office asks:
“Write a query to find students above 80 marks.”
Instead, real work usually sounds like this:
- “Can you identify outlets with zero sales?”
- “Need region-wise monthly summary before evening.”
- “Which SKUs are underperforming?”
- “Why are duplicate invoices showing in reports?”
- “Can we reduce manual Excel work?”
This is where SQL becomes genuinely useful.
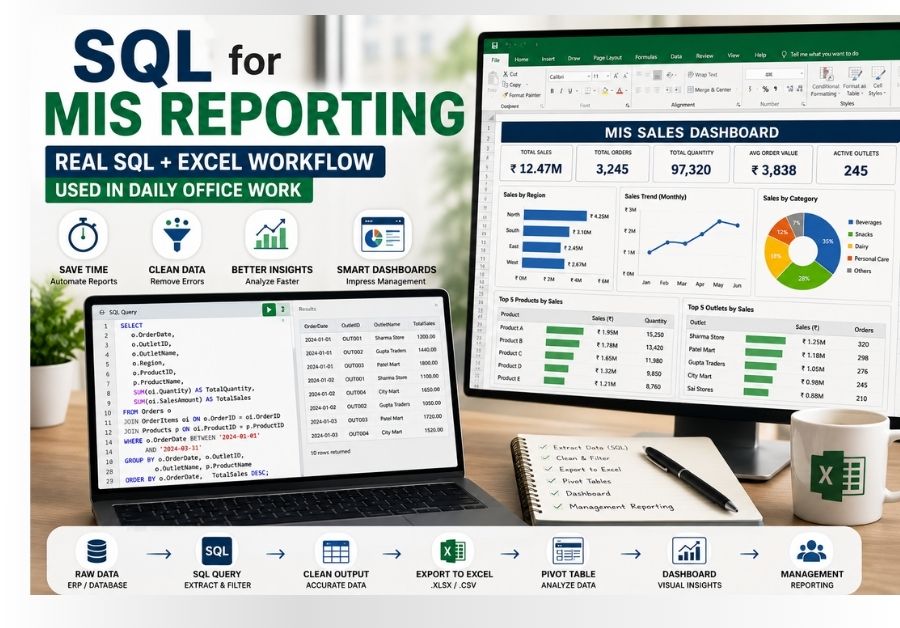
This guide explains how SQL for MIS Reporting is actually used in daily office work along with Excel dashboards, reports, and business data analysis.
If you are new to SQL, you can also read my detailed guide on SQL for data analysis techniques to understand more practical query examples.
SQL for MIS Reporting is mainly used to clean, filter, summarize, and analyze large business datasets before creating Excel dashboards, Pivot Tables, KPI reports, and management summaries.
My Realization About SQL Came From Excel Problems
Honestly, I did not start learning SQL because of my passion for coding.
I started because Excel alone was becoming difficult to manage.
In the beginning, manual reporting looked manageable:
- filtering data manually
- using formulas repeatedly
- copying summaries
- creating Pivot Tables
- preparing reports every day
But once the reporting workload increased, small tasks started consuming too much time.
For example:
- one wrong formula affected entire reports
- duplicate records created confusion
- large files became slow
- VLOOKUP references broke frequently
- monthly summaries took too long
The biggest problem was this:
finding only the required data from huge raw files.
That’s where SQL changed the workflow completely.
If you want to improve this part, my guide on Excel skills for data analysis explains the core Excel skills used in reporting work.
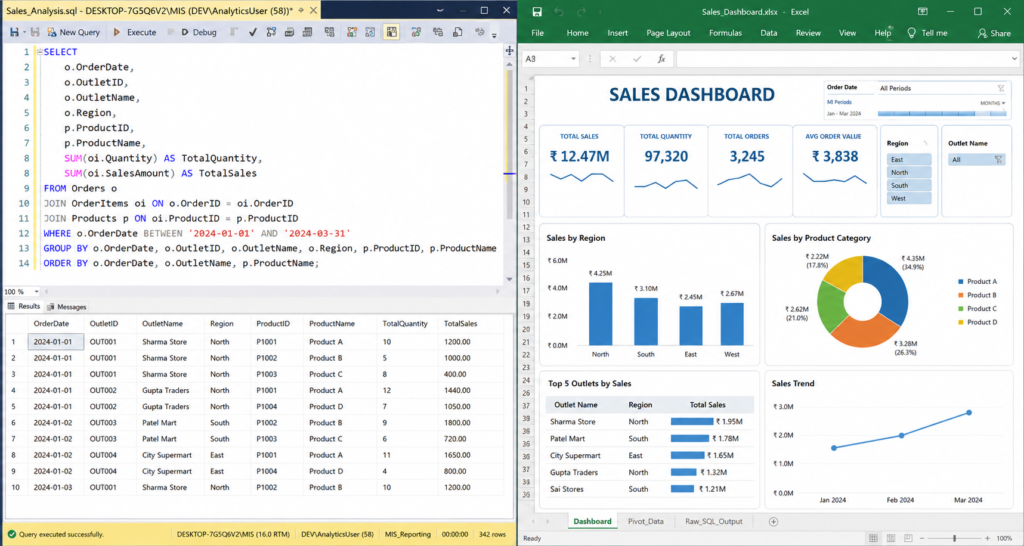
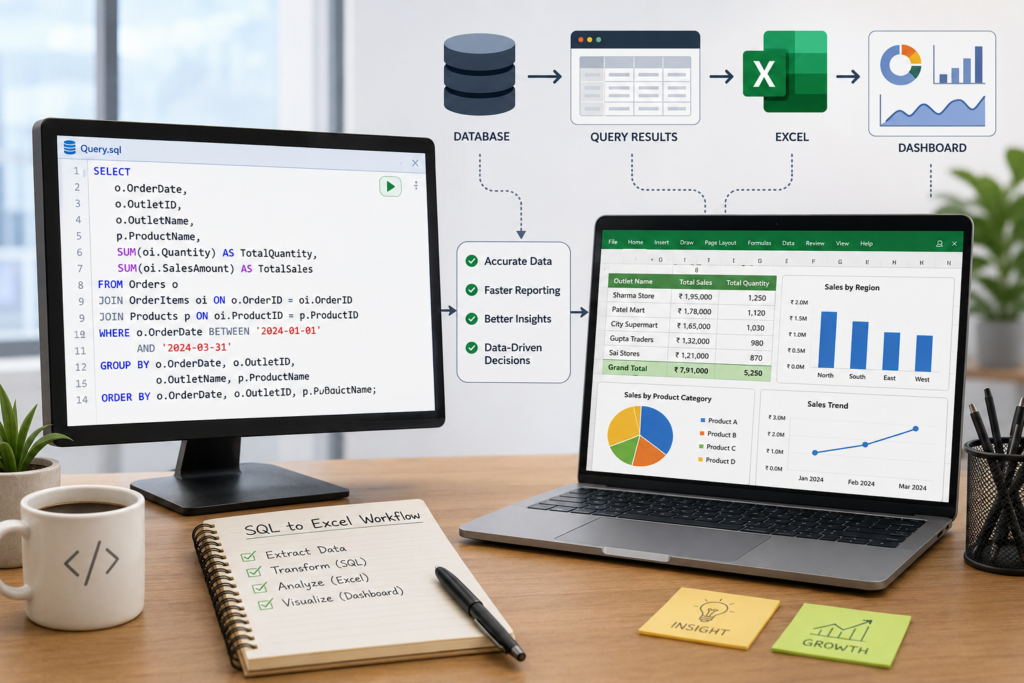
Real SQL for MIS Reporting Workflow
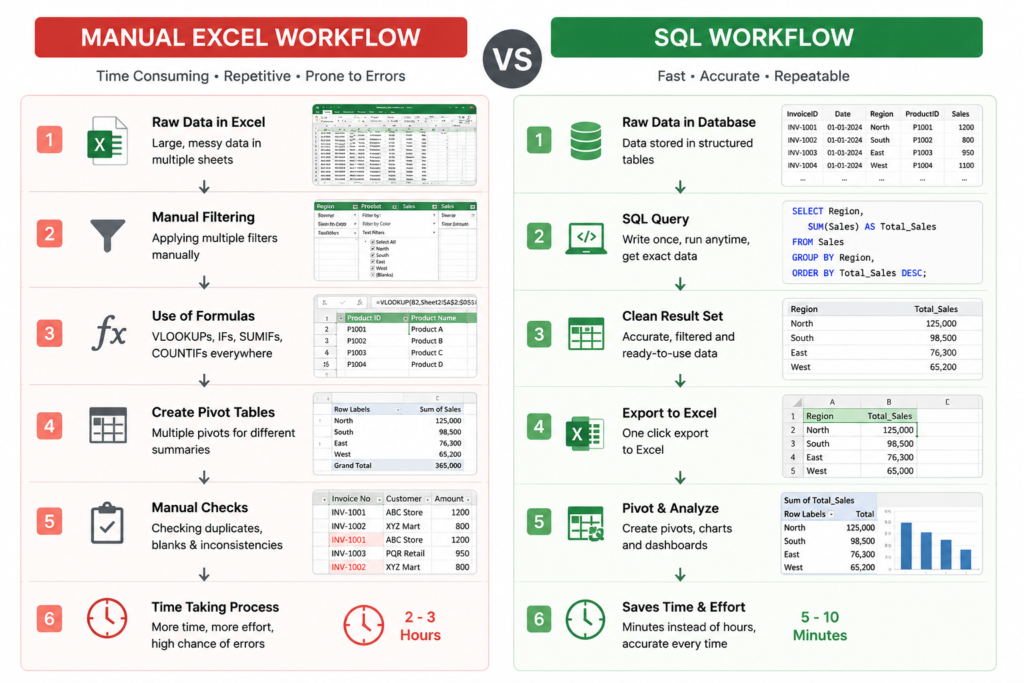
One thing many beginners misunderstand is that SQL alone does not create final dashboards.
In many offices, SQL works together with Excel.
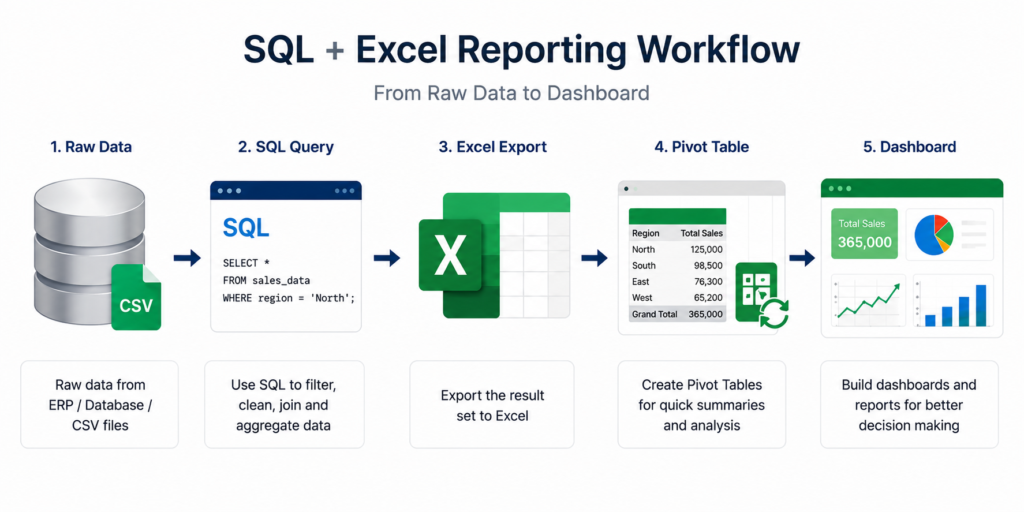
A practical workflow usually looks like this:
This is a very realistic workflow used in many reporting environments.
SQL helps in:
- extracting clean data
- filtering records
- combining datasets
- removing duplicates
- creating summaries
Then Excel helps in:
- dashboard design
- charts
- presentations
- KPI reports
- Pivot analysis
This combination is extremely powerful.
That is why SQL for MIS Reporting has become an important skill for many MIS Executives and reporting professionals today.
And honestly, this is where many beginners miss the practical side of learning SQL.
The Biggest Reporting Problems Before Using SQL
At one point, even opening some Excel files became frustrating.
That was the stage where I realized SQL is not only for developers or software engineers. Even people working in reporting, MIS, sales operations, and analytics can save a huge amount of time using basic SQL.
Before using SQL regularly, many tasks felt repetitive and time-consuming.
Some of these problems are extremely common in reporting jobs.
1. Huge Raw Files Became Slow
I personally started understanding the real value of SQL only after handling large Excel reports in MIS-related work.
Initially, I was fully dependent on Excel formulas, filters, Pivot Tables, and manual cleaning. It worked fine when the data was small.
This is also why I shared my real experience on how I improved my Excel skills while working full-time.
But slowly the files became bigger.
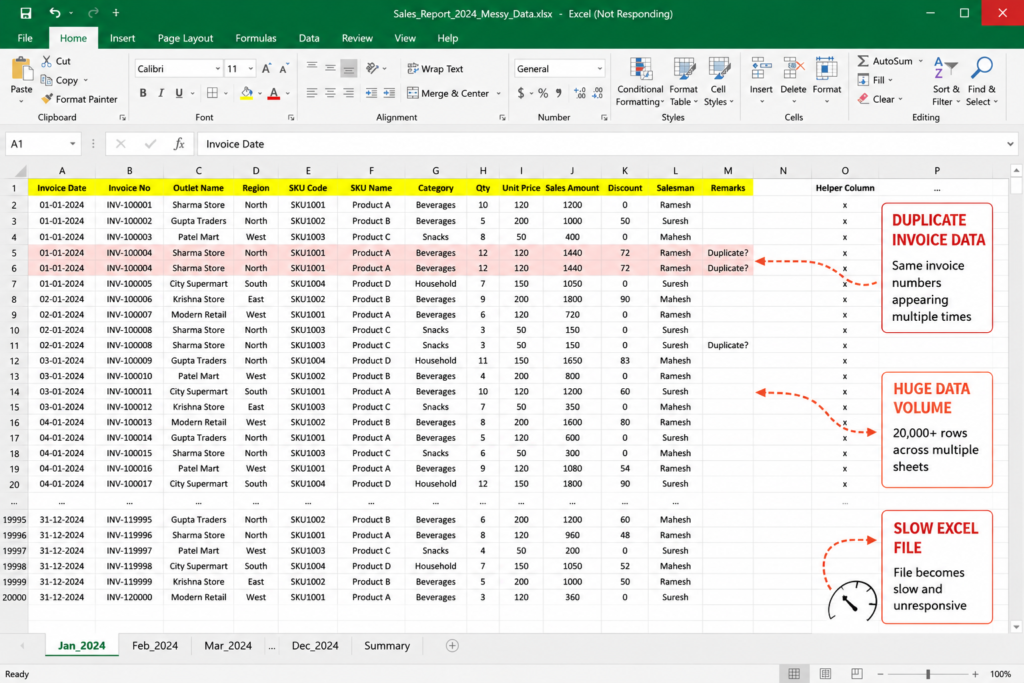
Some reports had:
- 20,000+ rows
- multiple sheets
- repeated VLOOKUP formulas
- duplicate invoice data
- outlet-wise sales tracking
- SKU-level summaries
And due to these huge datasets and heavy formulas, Excel files often became slow and difficult to manage and sometimes:
- Excel froze
- formulas recalculated slowly
- Pivot Tables lagged
- multiple sheets became difficult to handle
This especially happens in:
- sales reporting
- inventory reports
- outlet tracking
- distributor data
2. Too Much Manual Filtering
Every day the same repetitive work happened:
- filtering specific regions
- selecting SKU categories
- removing blank values
- identifying top products
- generating summaries
Doing this manually every single day wastes a huge time.
SQL reduced much of this effort.
3. Duplicate Data Created Reporting Issues
This was one of the biggest practical problems.
Sometimes:
- same invoice appeared twice
- outlet names were inconsistent
- duplicate rows affected totals
Manual checking became difficult when the dataset was large.
SQL queries made duplicate detection much easier.
4. Monthly Comparison Reports Took Too Long
Management frequently asks questions like:
- Which region improved?
- Which SKU dropped?
- Which salesman performed best?
- What changed compared to last month?
Doing these comparisons manually inside Excel consumed too much time.
SQL simplified these summaries significantly.
This practical workflow is exactly how SQL for MIS Reporting helps reduce repetitive reporting work in real office environments.
How SQL for MIS Reporting Improved My Daily Workflow
One of the biggest advantages of SQL is speed.
Even basic queries can reduce manual work massively.
After learning SQL basics properly, I noticed several improvements:
- reports became faster
- filtering became easier
- data cleaning improved
- duplicate checking became quicker
- report accuracy improved
And surprisingly, most of the useful work came from very basic SQL concepts.
You do not need advanced programming knowledge for many MIS-related roles.
In fact, even simple SQL knowledge can create a noticeable productivity improvement.
For many beginners, learning SQL for MIS Reporting becomes easier once they start solving real reporting problems instead of only practicing theory.
Real SQL Queries That Are Actually Useful in Reporting Jobs
This is probably the most practical section of this article.
Instead of textbook examples, let’s discuss the type of SQL queries that are genuinely useful in reporting work.
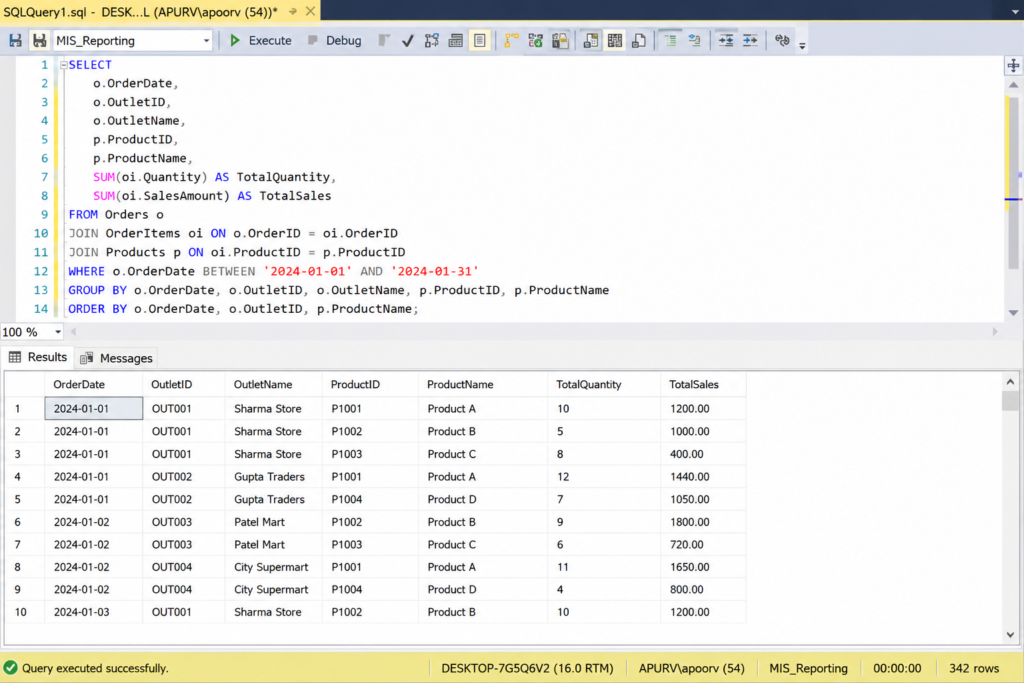
Finding Top Selling Products
One of the most common reporting requests is:
Which products are performing best?
Here’s a simple practical query:
SELECT product_name,
SUM(sales_amount) AS total_sales
FROM sales_data
GROUP BY product_name
ORDER BY total_sales DESC;
This query helps in:
- identifying high-performing SKUs
- preparing management reports
- tracking product performance
- building dashboard summaries
Very commonly used in:
- FMCG reporting
- retail analytics
- distributor reports
These are practical examples of how SQL for MIS Reporting is used in real business environments daily.
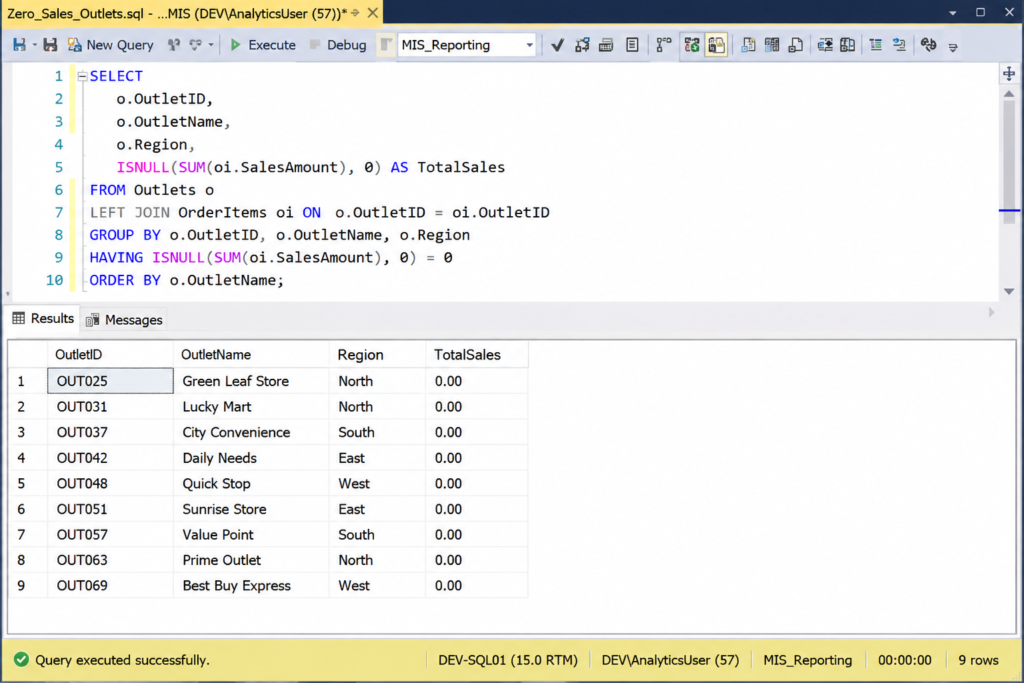
Identifying Zero Sales Outlets
Another very practical task is identifying inactive outlets.
Sometimes management wants to know:
Which outlets are not generating sales?
SQL makes this easy.
SELECT outlet_name
FROM sales_data
WHERE sales_amount = 0;
This helps in:
- outlet activation tracking
- salesman follow-up
- identifying inactive markets
- distributor performance review
This is one of the most practical SQL use cases in sales reporting.
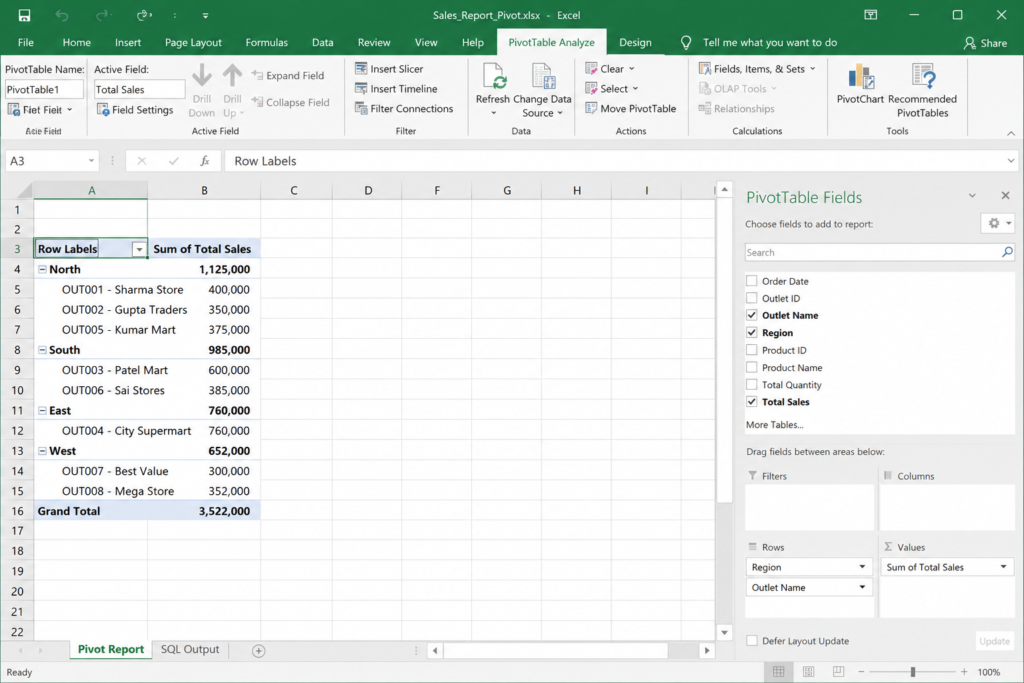
Region Wise Sales Summary
This is another reporting task that happens frequently.
SELECT region,
SUM(sales_amount) AS total_sales
FROM sales_data
GROUP BY region;
This query becomes extremely useful while preparing:
- regional performance reports
- territory reviews
- monthly summaries
- management dashboards
After exporting this output to Excel, Pivot Tables become much easier to build.
This same SQL-to-Excel process can also be used while building practical projects inside the Real Data Lab section.
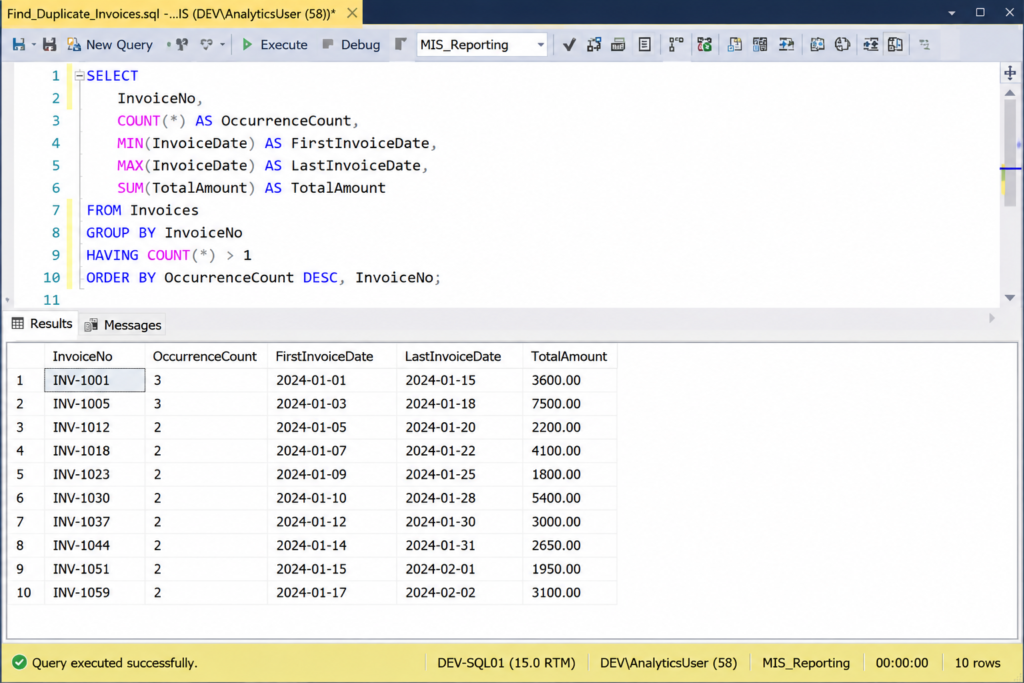
Detecting Duplicate Invoice Records
Duplicate invoice entries can create major reporting issues.
Instead of manually checking thousands of rows, SQL can detect duplicates quickly.
SELECT invoice_number,
COUNT(*)
FROM sales_data
GROUP BY invoice_number
HAVING COUNT(*) > 1;
This is especially useful for:
- audit preparation
- data validation
- report cleaning
- invoice verification
Why SQL + Excel Together Is So Powerful
Many beginners compare SQL and Excel as if one replaces the other.
That’s not how real office workflows usually work.
SQL and Excel complement each other.
A strong understanding of SQL for MIS Reporting can significantly improve dashboard preparation and reporting efficiency.
SQL is excellent for:
- extracting data
- filtering records
- handling large datasets
- combining multiple tables
- removing unnecessary rows
Excel is excellent for:
- visualization
- dashboard creation
- management presentation
- Pivot Tables
- charts and KPIs
In real reporting jobs, both tools are often used together.
That is why SQL for MIS Reporting has become an important skill for many MIS Executives and reporting professionals today.
And honestly, this combination is far more practical than learning only theoretical SQL concepts.
You can also explore the official Microsoft Excel support portal to learn more about Excel reporting features.
SQL Skills That Actually Matter in MIS Jobs
One thing I personally noticed is that many beginners overcomplicate SQL learning.
They think they must learn:
- advanced stored procedures
- complex scripting
- highly advanced optimization
before applying for jobs.
But in many reporting and MIS roles, the most commonly used SQL concepts are actually simple.
The majority of practical reporting work usually uses:
- SELECT
- WHERE
- GROUP BY
- ORDER BY
- JOIN
- SUM
- COUNT
- CASE WHEN
That’s it.
Even these basics can solve a huge number of business reporting problems.
This is why beginners should focus on practical SQL for MIS Reporting instead of only theoretical SQL tutorials.
5 Real Benefits of Using SQL in MIS Reporting
One of the biggest reasons many reporting professionals start learning SQL is because manual Excel reporting becomes difficult once datasets grow larger. In real office environments, SQL helps reduce repetitive work, improve reporting speed, and create cleaner business summaries with better accuracy.
Faster Report Preparation
SQL helps professionals filter and summarize large datasets much faster compared to manual Excel work.
Better Dashboard Accuracy
Clean SQL outputs help create more accurate Excel dashboards, Pivot Tables, KPI reports, and summaries.
Easier Data Cleaning
SQL makes it easier to identify duplicate records, missing values, inactive outlets, and unnecessary rows.
Better Business Insights
SQL helps professionals identify sales trends, top-performing products, and business growth opportunities.
Reduced Manual Excel Work
SQL automates repetitive filtering and summarization tasks, reducing dependency on heavy Excel formulas.
Common SQL Mistakes Beginners Make
While learning SQL, beginners often make similar mistakes.
I made a few of these mistakes myself when I was starting out.
1. Using SELECT *
Many beginners fetch unnecessary columns using:
SELECT * FROM sales_data;
This becomes inefficient on large datasets.
Better practice:
fetch only required columns.
2. Ignoring NULL Values
NULL values often affect summaries and totals.
Always check missing values carefully while preparing reports.
3. Writing Overcomplicated Queries
Some beginners try writing extremely large queries unnecessarily.
Simple and readable queries are easier to maintain in office environments.
4. Depending Completely on Excel
Excel is powerful.
But once data becomes large, SQL becomes extremely useful for cleaning and filtering.
The best approach is combining both tools together.
Practical SQL Projects Beginners Should Build
If someone wants to practice SQL properly for reporting jobs, I strongly suggest using practical business datasets instead of random student tables.
Some excellent beginner-friendly project ideas are:
Sales Dashboard Using SQL + Excel
Create:
- monthly sales summary
- region-wise charts
- KPI cards
Inventory Monitoring Report
Track:
- low stock items
- out-of-stock products
- fast-moving SKUs
Outlet Performance Analysis
Analyze:
- top outlets
- inactive outlets
- region performance
Salesman Performance Tracker
Track:
- target achievement
- highest sales
- territory performance
These projects look much stronger on resumes compared to generic academic projects.
You can also mention these projects properly in your Data Analyst Resume to show practical SQL and reporting experience.
Best Free Platforms for SQL Practice
If you want clean screenshots for your article, these tools work very well.
DB Fiddle
Very useful for:
- creating sample tables
- running SQL queries
- generating clean screenshots
SQLite Online
Simple interface for beginners.
W3Schools SQL Editor
Easy for quick SQL testing.
Real Office Tasks SQL Can Simplify
SQL is commonly used in real office environments to reduce repetitive Excel work, simplify reporting tasks, and improve reporting accuracy. These are some practical examples where SQL becomes extremely useful.
Finding Inactive Outlets
Identify outlets with zero sales or missing transactions without manually filtering large Excel datasets.
Tracking Low Stock Inventory
Monitor low inventory products and quickly identify stock shortages before they affect operations.
Monthly Sales Comparison
Compare monthly business performance data to understand sales growth and reporting trends.
Region-wise Sales Summaries
Generate quick regional summaries for management dashboards and territory-level reporting.
Duplicate Invoice Detection
Detect repeated invoice records and reduce reporting inaccuracies caused by duplicate entries.
Salesman Performance Analysis
Track individual performance, target achievements, and contribution to overall sales growth.
Distributor-wise Reporting
Prepare distributor-level reports for order tracking, outlet coverage, and sales monitoring.
SKU Performance Tracking
Analyze top-performing and underperforming SKUs to support product-level business decisions.
🚀 Explore More Practical SQL & MIS Guides
If you enjoy learning through real business examples, explore more SQL, Excel, MIS reporting, and dashboard tutorials on DataSkillZone.
Real Experience
One thing I personally realized while working with large reporting files is that SQL is not mainly about coding — it is about reducing repetitive work. Even very basic queries helped me save reporting time, clean data faster, and reduce manual Excel work significantly in daily MIS reporting tasks.
Final Thoughts
Learning SQL completely changed how I handle reporting work.
Earlier, many tasks were repetitive and manual.
But after combining SQL with Excel:
- reporting became faster
- summaries became easier
- filtering improved
- dashboards became cleaner
- duplicate detection became simpler
And honestly, the best part is this:
You do not need to become a software engineer to benefit from SQL.
Even basic SQL knowledge can significantly improve reporting efficiency for:
- MIS Executives
- Excel users
- reporting professionals
- aspiring Data Analysts
- operations teams
Beginners can also follow this complete Data Analyst Career Roadmap to understand where SQL fits in the full learning journey.
In real office environments, SQL is not about complex coding – it’s mainly used to solve practical business problems more efficiently.
That practical approach is what truly makes SQL valuable.
Overall, SQL for MIS Reporting is less about advanced coding and more about solving real reporting challenges faster and more accurately.
If you are learning SQL for reporting jobs, focus more on solving practical business problems instead of memorizing complex theory.
Simple SQL Learning Path for Beginners
If you are completely new to SQL, do not try learning everything at once. In real reporting jobs, even basic SQL knowledge can solve many practical business problems. A simple and consistent learning approach works much better for beginners.
Frequently Asked Questions
Helpful answers to common questions about SQL for MIS reporting, Excel workflows, reporting dashboards, business analysis, SQL queries, and practical office reporting tasks.
Is SQL useful for MIS reporting?
Yes, SQL is extremely useful for MIS reporting because it helps professionals filter, clean, summarize, and analyze large business datasets much faster compared to manual Excel work alone. Even basic SQL queries can significantly improve reporting speed and accuracy.
Can Excel users learn SQL easily?
Yes, most Excel users can learn SQL quite easily because they already understand tables, filters, formulas, summaries, and reporting logic. SQL mainly helps automate and simplify many tasks that are manually done inside Excel.
Which SQL queries are most useful in reporting jobs?
In most reporting and MIS jobs, the most commonly used SQL queries include SELECT, WHERE, GROUP BY, ORDER BY, JOIN, COUNT, SUM, and CASE WHEN. These basic queries are enough to solve many practical business reporting tasks.
How is SQL used with Excel in real office work?
In many offices, SQL is used for extracting, filtering, and cleaning data from databases, while Excel is used for Pivot Tables, charts, dashboards, KPI tracking, and management reporting. Together, SQL and Excel create a very powerful reporting workflow.
Is SQL required for Data Analyst jobs?
Yes, most modern Data Analyst jobs require at least basic SQL knowledge because analysts frequently work with business databases, sales reports, dashboards, and reporting systems that involve large datasets.
Can SQL reduce manual Excel work?
Absolutely. SQL can automate repetitive filtering, duplicate checking, summarization, and data extraction tasks, which reduces manual Excel work significantly and helps professionals prepare reports faster.
Do I need advanced SQL for MIS reporting roles?
No, many MIS and reporting roles mainly require basic to intermediate SQL skills. Practical knowledge of SELECT, WHERE, GROUP BY, JOIN, and aggregation functions is usually enough for handling daily reporting tasks.