Introduction
Power BI is widely used in modern business intelligence dashboards, but visuals alone are not enough to deliver real insights. The real power of Power BI comes from advanced DAX formulas in Power BI, which transform raw data into meaningful business intelligence.
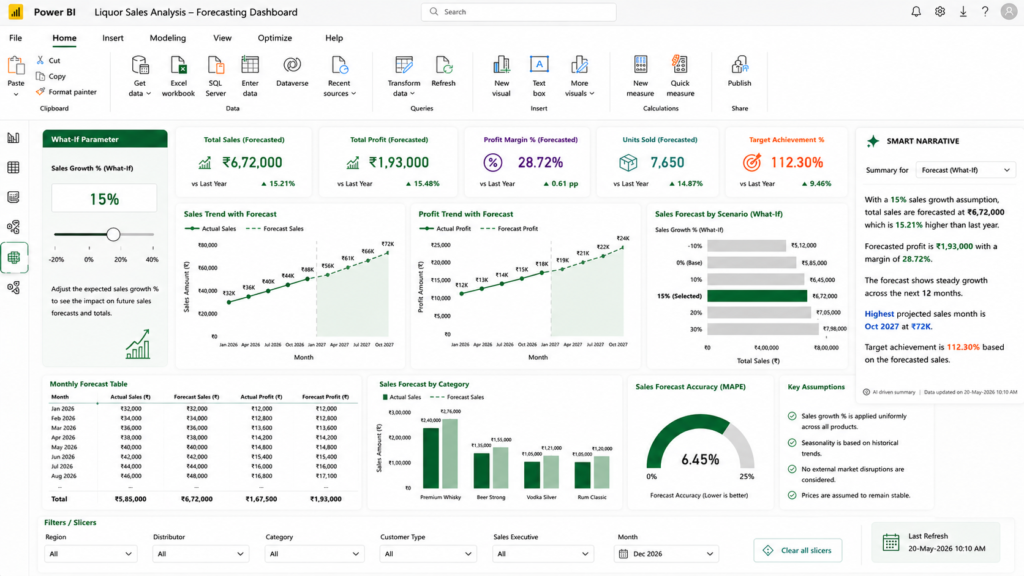
Today, organizations across sales, finance, operations, and supply chain depend on Power BI dashboards not just for reporting, but for decision-making and forecasting.
However, most beginners struggle with DAX because they only learn syntax – not real business logic.
To understand the fundamentals of DAX in a structured way, you can refer to the official Microsoft documentation, which explains how DAX works inside Power BI models and why it is essential for advanced analytics.
In this article, you will learn 11 advanced DAX formulas in Power BI with real dashboard examples that are actively used in professional business environments. These are not basic textbook formulas, but practical calculations used in real reporting systems for:
- Sales performance tracking
- Profitability analysis
- Time intelligence reporting
- Advanced filtering and relationships
- Scenario planning and forecasting
If you are completely new to Power BI development, you can first go through this structured learning path:
Power BI Developer Career Guide 2026 (Beginner to Advanced)
By the end, you will understand how real Power BI dashboards are built in companies.
Quick Answer
Advanced DAX formulas in Power BI are mainly used to transform raw data into meaningful business insights by enabling calculations such as profit analysis, KPI tracking, time intelligence reporting, forecasting, and dynamic filtering for interactive dashboards.
Why Advanced DAX Formulas Are Important in Power BI Dashboards
Advanced DAX formulas in Power BI are essential for turning basic reports into dynamic, insight-driven dashboards. While visuals like charts and tables display data, they cannot provide meaningful business intelligence without strong calculations behind them.
Key Importance
- Enables real-time decision-making through dynamic calculations
- Automates complex business logic like profit, sales, and KPI tracking
- Improves accuracy with row-level and context-aware calculations
- Supports advanced analytics such as time intelligence and forecasting (SUMX, DATESYTD, PARALLELPERIOD)
- Enhances performance tracking for sales, targets, and profitability
Overall, advanced DAX transforms Power BI into a powerful business intelligence system that supports faster and smarter decision-making.
Microsoft also highlights the importance of DAX as the core calculation language in Power BI, especially for building dynamic measures, time intelligence, and advanced business logic in reports.
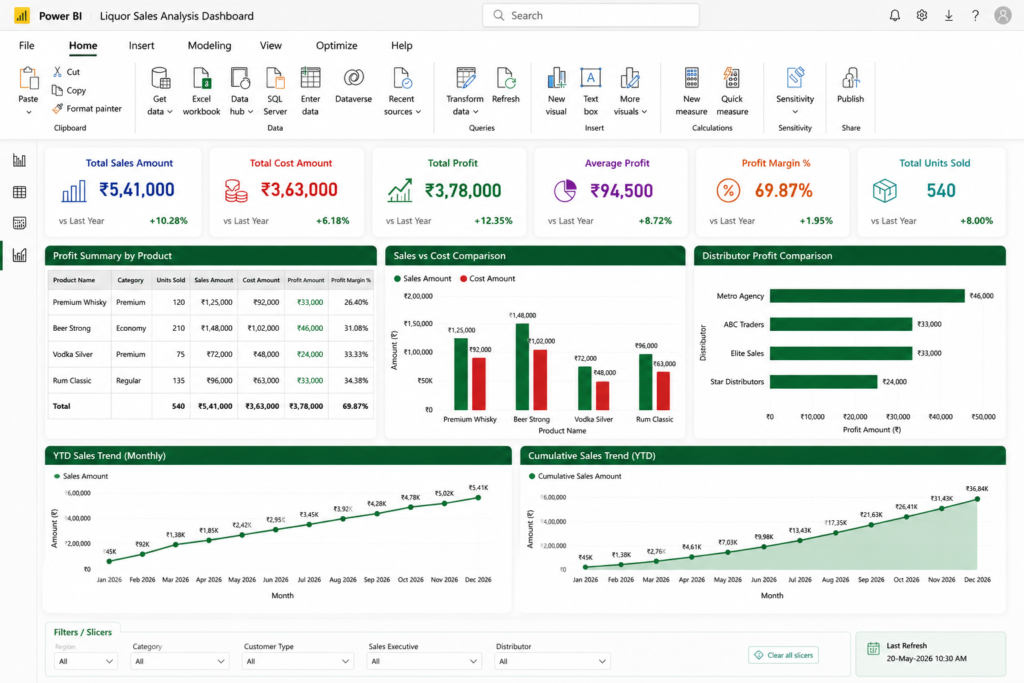
Power BI Dataset Structure Used in This Example
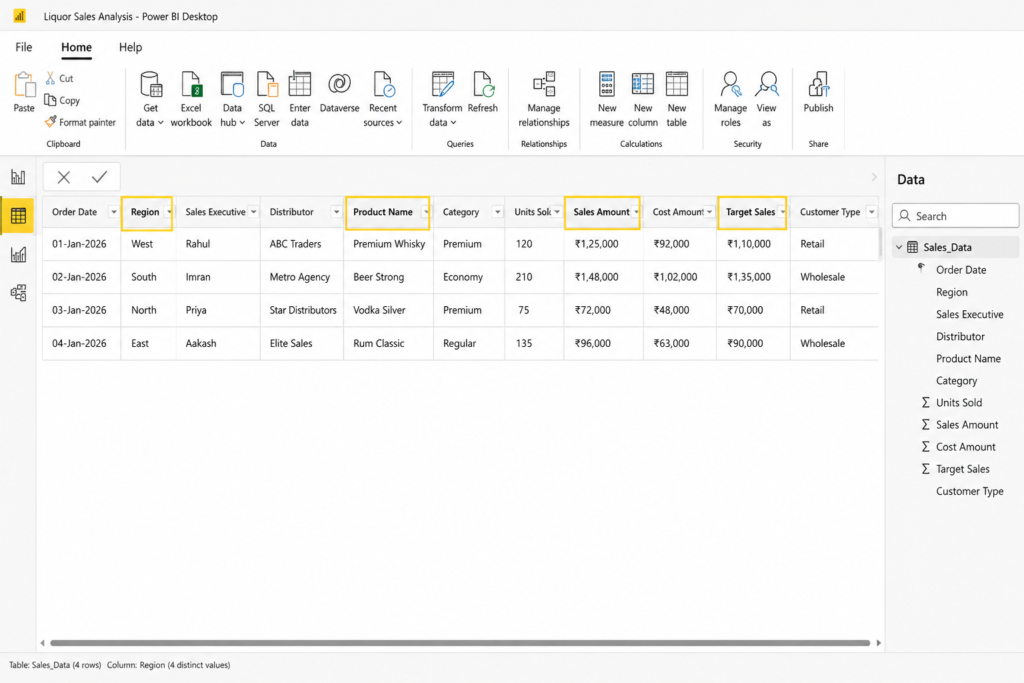
Before creating DAX formulas, it is important to understand the dataset structure being used inside the dashboard.
Below is a practical sales reporting dataset example commonly used in Power BI business dashboards.
| Order Date | Region | Sales Executive | Distributor | Product Name | Category | Units Sold | Sales Amount | Cost Amount | Target Sales | Customer Type | Profit Status |
|---|---|---|---|---|---|---|---|---|---|---|---|
| 01-Jan-2026 | West | Rahul | ABC Traders | Premium Whisky | Premium | 120 | ₹1,25,000 | ₹92,000 | ₹1,10,000 | Retail | Above Target |
| 02-Jan-2026 | South | Imran | Metro Agency | Beer Strong | Economy | 210 | ₹1,48,000 | ₹1,02,000 | ₹1,35,000 | Wholesale | Above Target |
| 03-Jan-2026 | North | Priya | Star Distributors | Vodka Silver | Premium | 75 | ₹72,000 | ₹48,000 | ₹70,000 | Retail | Above Target |
| 04-Jan-2026 | East | Aakash | Elite Sales | Rum Classic | Regular | 135 | ₹96,000 | ₹63,000 | ₹90,000 | Wholesale | Above Target |
This type of dataset is commonly used for:
- sales dashboards
- distributor analysis
- profitability tracking
- target achievement reports
- executive KPI dashboards
- regional performance monitoring
Advanced DAX formulas in Power BI
When to Use Advanced DAX in Power BI
Advanced DAX should be used when basic aggregations are not enough to solve business problems. It becomes essential in scenarios like dynamic KPI calculations, time-based comparisons, multi-table relationships, and real-time business dashboards.
11 Advanced DAX Formulas in Power BI with Business Examples
Before diving into individual formulas, it is important to understand that DAX functions follow a structured reference system provided by Microsoft, which includes all available functions used in real-world Power BI development.
In this section, we will explore Advanced DAX formulas in Power BI used in real enterprise dashboards.
1. SUMX – Advanced Row-Level Calculations
SUMX is one of the most important Advanced DAX formulas in Power BI for handling row-level calculations.
Unlike normal SUM formulas, SUMX performs calculations row by row before generating final totals. This makes it extremely useful for advanced business logic.
DAX Formula
This formula calculates profit for every transaction individually before combining the final values.
In real business dashboards, SUMX is commonly used for:
- profit calculations
- weighted averages
- commission tracking
- inventory valuation
- dynamic row calculations
For example, if:
- Sales = ₹1,25,000
- Cost = ₹92,000
then Profit becomes ₹33,000 automatically.
This approach becomes very powerful when datasets contain thousands of transactions because calculations remain dynamic and scalable.
Profit calculation using SUMX DAX formula in Power BI
2. AVERAGEX – Smarter Average Analysis
Many businesses need average calculations based on transaction-level analysis instead of simple averages.
AVERAGEX helps calculate averages dynamically across rows.
DAX Formula
This formula calculates average profit generated per order.
Businesses use this for:
- customer profitability
- order analysis
- average basket value
- transaction performance
- distributor efficiency
This becomes extremely useful when management wants to understand not only total revenue, but also transaction quality.
For example:
- one distributor may generate huge sales
- but average profit margin may remain low
AVERAGEX helps uncover such business insights properly.
Average transaction profit using AVERAGEX formula
3. DATESYTD – Dynamic Annual Performance Tracking
Time intelligence functions like DATESYTD are officially recommended by Microsoft for financial and yearly reporting scenarios where cumulative performance tracking is required.
Businesses often compare current yearly progress against previous years.
DATESYTD helps generate dynamic year-to-date calculations.
DAX Formula
This formula accumulates revenue from the beginning of the year until the selected period.
This is heavily used in:
- annual dashboards
- financial reporting
- growth tracking
- executive reviews
Management teams often focus more on cumulative trends rather than individual months because it reflects overall business direction better.
Year-to-date revenue analysis using DATESYTD in Power BI
4. PARALLELPERIOD – Previous Quarter and Previous Year Analysis
This technique is widely used in Advanced DAX formulas in Power BI for historical performance comparison.
Businesses constantly compare performance against historical periods.
PARALLELPERIOD helps shift time periods intelligently.
DAX Formula
This formula compares current quarter performance against previous quarter sales.
Businesses use this heavily for:
- quarterly reviews
- seasonal analysis
- trend monitoring
- board presentations
This formula becomes extremely useful during financial planning meetings where management wants quick performance comparisons.
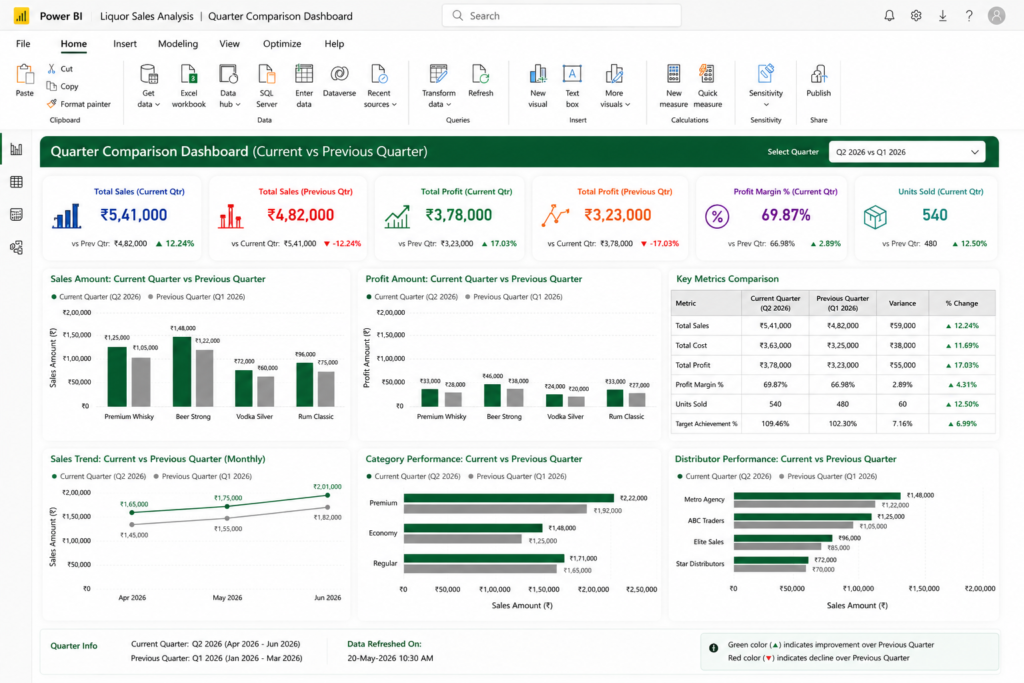
Quarterly sales comparison using PARALLELPERIOD
5. CONCATENATEX – Dynamic Text Generation
Many Power BI users ignore text-based DAX functions, but they are surprisingly powerful.
CONCATENATEX combines multiple values into a single readable output.
DAX Formula
This formula dynamically generates top product names in a single line.
Example Output:
- Premium Whisky, Beer Strong, Vodka Silver
This is useful for:
- executive summaries
- dashboard insights
- dynamic commentary
- smart narratives
This makes dashboards look much more premium and interactive.
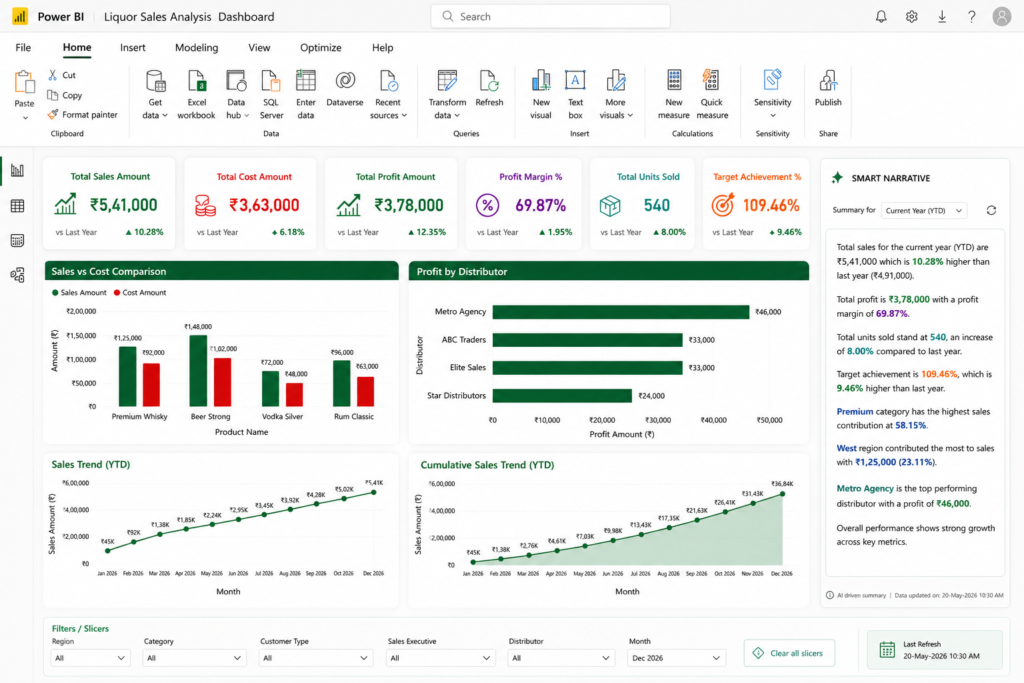
Dynamic product summary using CONCATENATEX formula
6. ISFILTERED – Detecting Dashboard Interactions
Professional dashboards often behave differently based on user selections.
ISFILTERED helps detect whether slicers are applied.
DAX Formula
This formula dynamically updates dashboard status messages.
Businesses use this for:
- interactive dashboards
- filter awareness
- user guidance
- dynamic reporting
Small dynamic messages improve dashboard usability significantly.
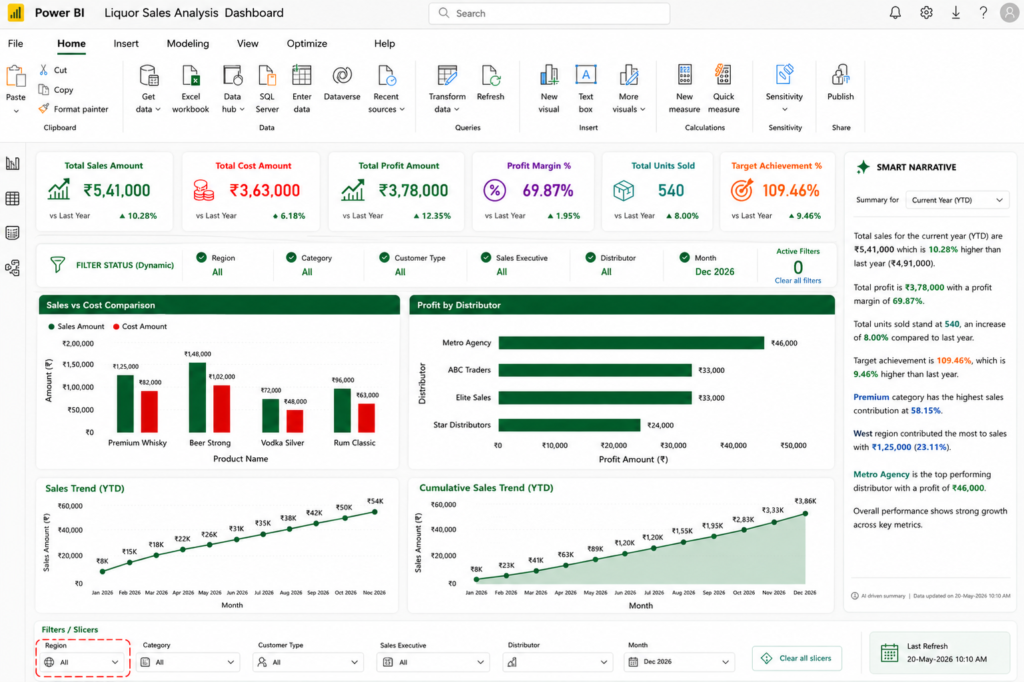
Interactive dashboard filter detection using ISFILTERED
7. USERELATIONSHIP – Activating Alternate Relationships
Many business datasets contain multiple date columns.
For example:
- Order Date
- Delivery Date
- Invoice Date
USERELATIONSHIP helps activate alternate relationships dynamically.
DAX Formula
This allows dashboards to analyze delivery-based performance instead of order-based performance.
This is extremely useful in:
- logistics reporting
- supply chain dashboards
- delivery performance analysis
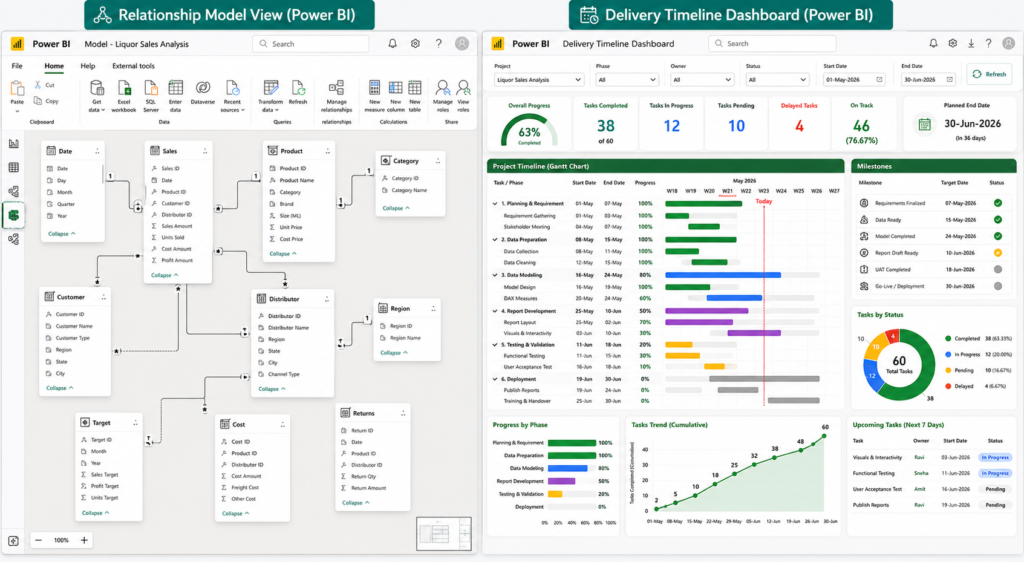
Using USERELATIONSHIP in Power BI data model
8. CROSSFILTER – Advanced Relationship Control
CROSSFILTER helps temporarily modify relationship directions inside calculations.
DAX Formula
This formula improves advanced filtering interactions across related tables.
Businesses use this for:
- many-to-many relationships
- complex data models
- distributor analysis
- cross-table filtering
Advanced enterprise dashboards rely heavily on relationship optimization.
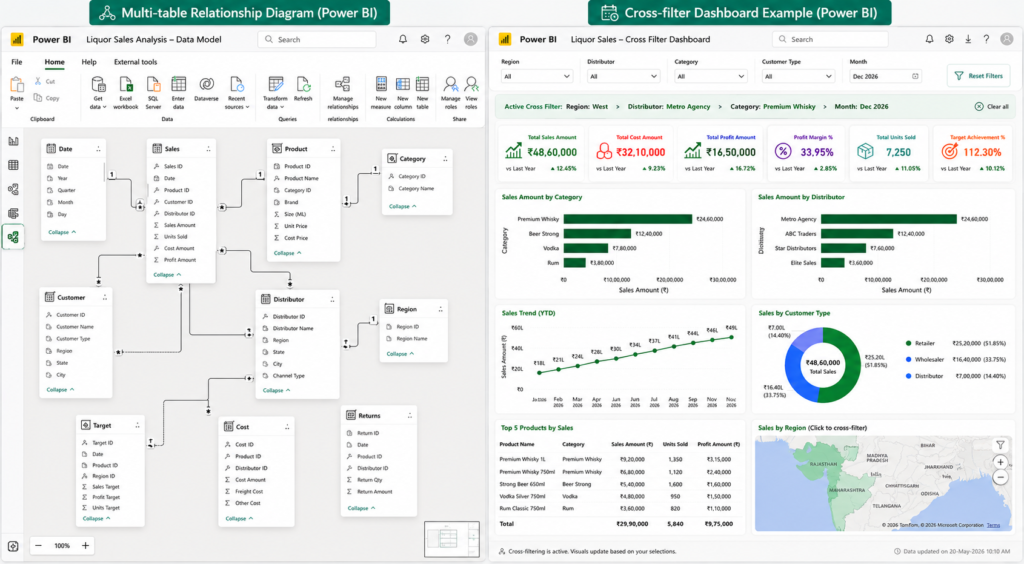
Advanced relationship filtering using CROSSFILTER
9. TREATAS – Virtual Relationship Creation
Sometimes tables have no direct relationship. TREATAS creates virtual relationships dynamically.
DAX Formula
This formula applies region filters from another disconnected table.
Businesses use TREATAS for:
- disconnected slicers
- custom filtering
- advanced segmentation
- virtual data modeling
This is considered one of the more advanced DAX techniques in professional dashboards.
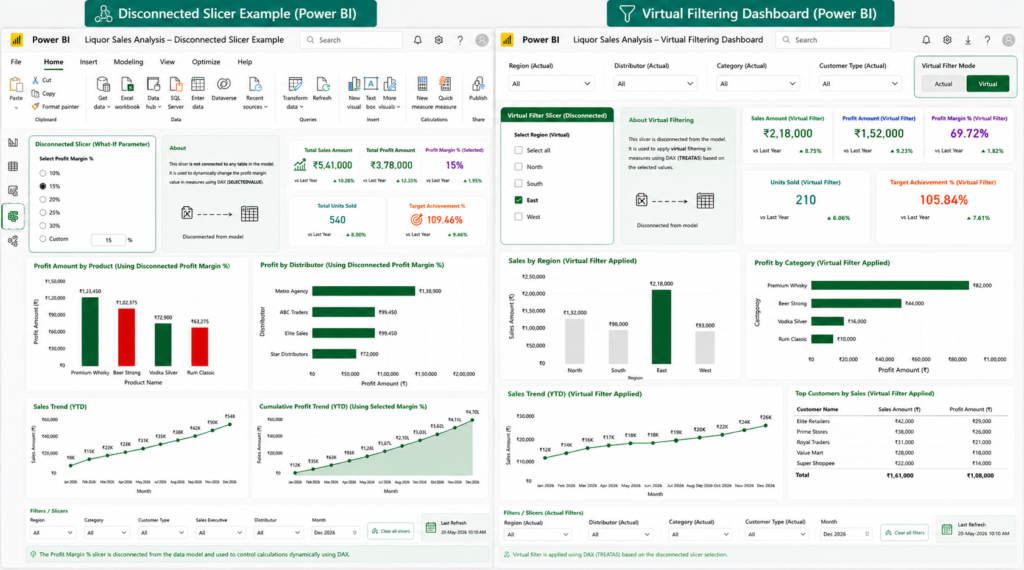
Virtual table relationships using TREATAS in Power BI
10. ROLLUP – Hierarchical Reporting Analysis
ROLLUP helps create subtotal and grand total logic inside summarized tables.
DAX Formula
This generates:
- category totals
- region totals
- grand totals
Businesses use this for:
- management summaries
- hierarchical reports
- executive dashboards
- financial statements
This creates much cleaner summary reporting structures.
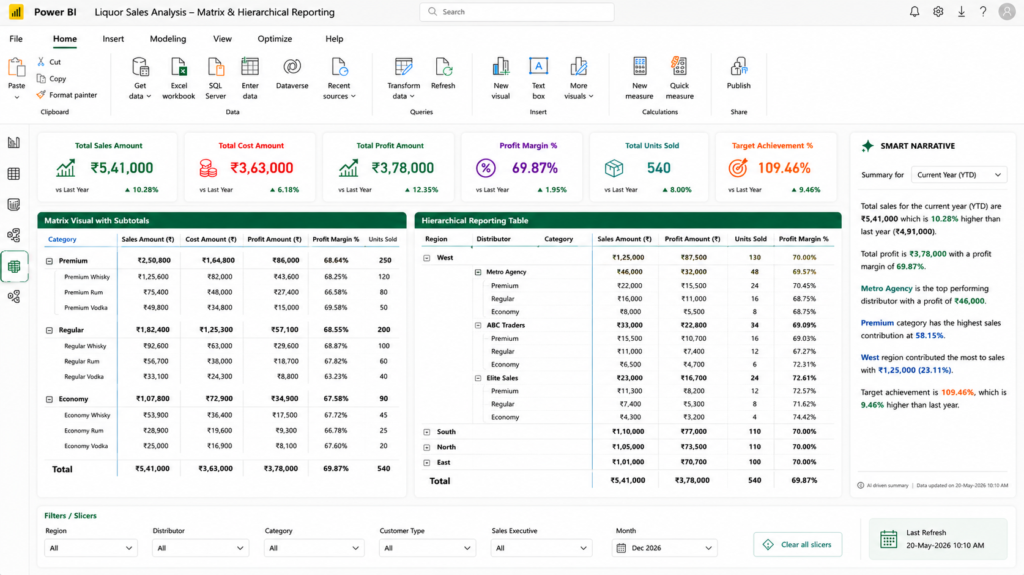
Hierarchical reporting using ROLLUP in Power BI
11. GENERATESERIES – Dynamic Scenario Planning
GENERATESERIES creates numeric ranges dynamically.
This becomes extremely useful for forecasting and scenario analysis.
DAX Formula
This generates discount values:
- 0%
- 5%
- 10%
- 15%
- 20%
Businesses use this for:
- pricing simulations
- forecasting
- what-if analysis
- budget planning
Interactive scenario planning dashboards often depend heavily on this function.
What-if analysis using GENERATESERIES in Power BI
Real Business Use Cases of Advanced DAX in Power BI
In real-world organizations, Advanced DAX is not used for theory — it is the backbone of automated reporting, KPI monitoring, and decision intelligence across departments like sales, finance, and operations.
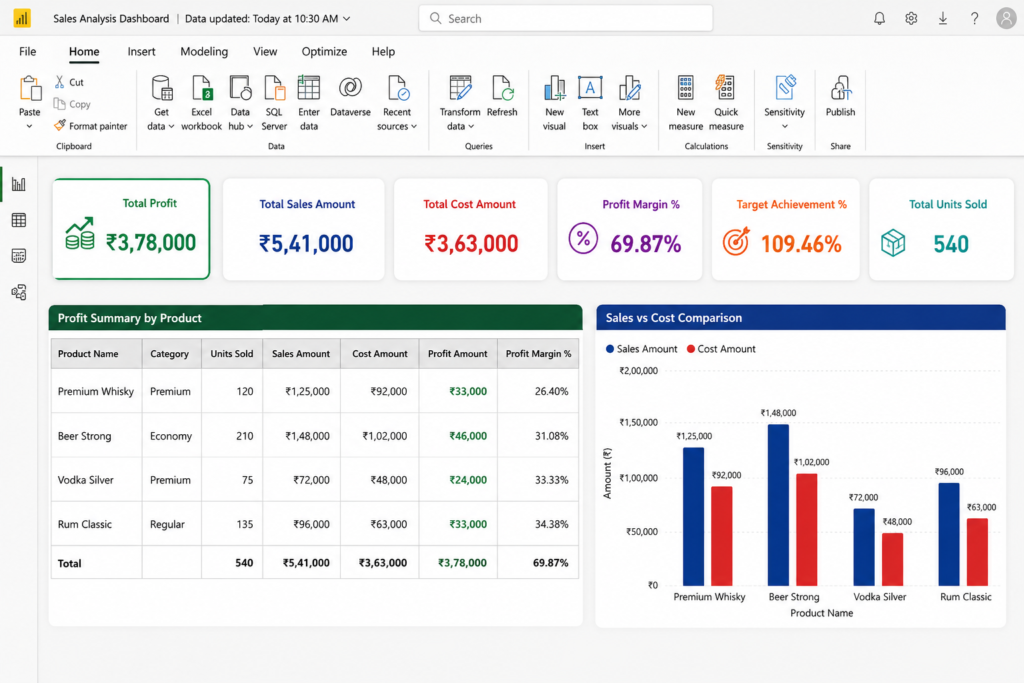
1. Sales Performance & Revenue Analytics
Businesses use DAX measures to track total revenue, profit margins, and target vs actual performance across regions, products, and sales teams in real time dashboards.
2. Financial Planning & Profitability Tracking
Finance teams rely on SUMX and CALCULATE to compute net profit, cost allocation, and margin analysis at transaction level for accurate financial reporting.
3. Time Intelligence & Trend Analysis
Functions like DATESYTD, SAMEPERIODLASTYEAR, and PARALLELPERIOD help organizations compare monthly, quarterly, and yearly performance trends for forecasting and budgeting.
4. Supply Chain & Operational Reporting
USERELATIONSHIP and CROSSFILTER are used to analyze delivery performance, shipment delays, inventory movement, and order fulfillment efficiency.
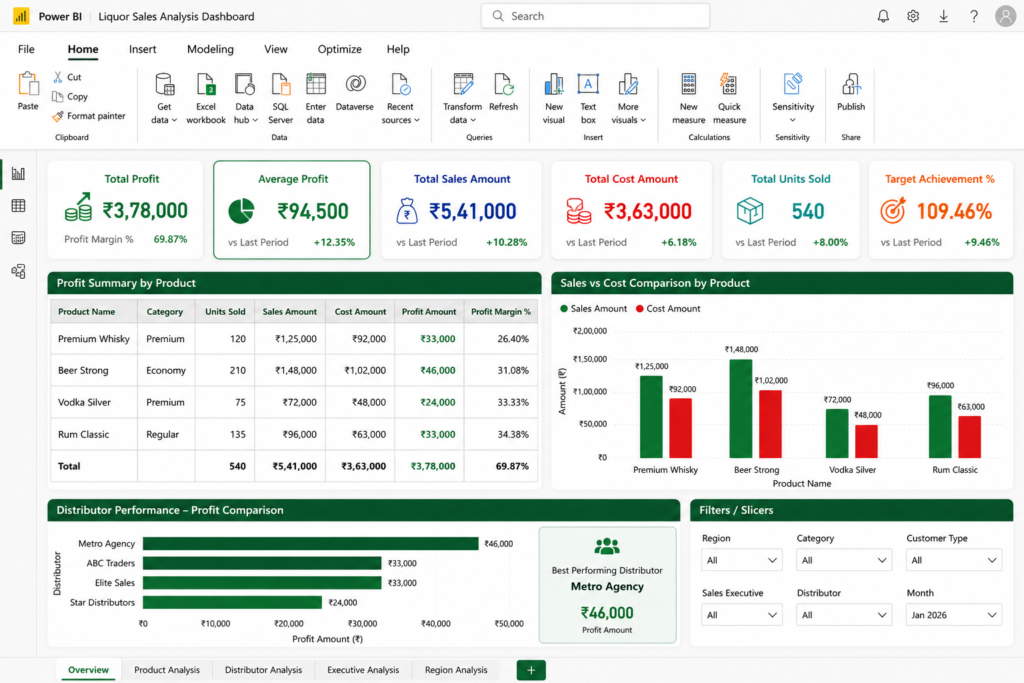
5. Executive KPI Dashboards
Top-level management depends on dynamic DAX-driven KPIs for strategic decision-making, performance tracking, and real-time business monitoring.
6. Customer & Product Performance Analysis
Businesses analyze customer behavior, product profitability, and buying patterns using AVERAGEX, FILTER, and CONCATENATEX for deeper insights.
Overall, Advanced DAX transforms Power BI from a simple reporting tool into an enterprise-level business intelligence system that supports fast, data-driven decision-making.
Before vs After Using Advanced DAX in Power BI
Understanding the impact of Advanced DAX becomes easier when we compare traditional reporting methods with modern Power BI dashboards powered by DAX formulas.
| Aspect | Before DAX (Traditional Reporting) | After DAX (Power BI Dashboard) |
|---|---|---|
| Data Processing | Manual Excel formulas and pivot tables | Automated calculations using DAX measures |
| Speed | Slow and time-consuming | Real-time dashboard updates |
| Accuracy | High risk of manual errors | Highly accurate context-based calculations |
| Reporting Type | Static reports | Dynamic interactive dashboards |
| Business Impact | Delayed decision-making | Faster and data-driven decision-making |
This comparison clearly shows how Advanced DAX transforms traditional reporting into a modern, automated, and intelligent business intelligence system used in companies worldwide.
Common Mistakes in Advanced DAX
- Using SUM instead of SUMX for row-level calculations
- Ignoring filter context in CALCULATE functions
- Not creating a proper Date Table for time intelligence
- Overusing complex nested DAX instead of variables (VAR)
- Missing relationships in the data model
Key Takeaways
- Advanced DAX formulas in Power BI help transform raw data into business-ready insights.
- Functions like SUMX, CALCULATE, and DATESYTD are essential for real-world dashboards.
- DAX works based on filter context and row context, which is critical for accuracy.
- Most enterprise Power BI dashboards rely heavily on advanced DAX logic.
- Mastering DAX improves your chances of becoming a Power BI Developer or BI Analyst.
Final Thoughts
Learning advanced DAX formulas can initially feel overwhelming, especially for beginners moving from Excel into Power BI. But once you start working with real business data, you quickly realize that DAX is not about memorizing formulas. It is about understanding how businesses think, how reporting logic works, and how dashboards can answer important questions automatically.
The formulas covered in this article are not random academic examples. These are practical business-focused DAX techniques used in real dashboards for:
- sales reporting
- profitability analysis
- executive KPI tracking
- forecasting
- trend analysis
- relationship management
- advanced filtering
To understand your complete growth path in analytics, you can follow this step-by-step roadmap:
Complete Data Analyst Career Roadmap 2026 (Beginner to Advanced)
And when you start applying for BI or analyst roles, salary negotiation becomes equally important. Use this guide to maximize your offer:
Data Analyst Salary Negotiation Guide 2026 (Step-by-Step)
Understanding both technical skills (DAX) and career strategy (roadmap + salary negotiation) is what separates beginners from professional data analysts.
Mastering Advanced DAX formulas in Power BI is what separates beginner analysts from professional BI developers.
Once you become comfortable with these advanced formulas, your dashboards stop looking like beginner reports and start looking like professional business intelligence solutions.
For deeper professional insights into advanced DAX patterns and real-world modeling techniques, SQLBI provides industry-level best practices used by enterprise Power BI developers worldwide.
Frequently Asked Questions
Helpful answers to common questions about advanced DAX formulas in Power BI, dashboard development, business intelligence reporting, and real-world analytics use cases.
What are advanced DAX formulas in Power BI used for?
Advanced DAX formulas in Power BI are used to perform complex calculations such as profit analysis, KPI tracking, time intelligence reporting, forecasting, and dynamic filtering across multiple data tables in business dashboards.
What is the difference between basic and advanced DAX?
Basic DAX includes simple functions like SUM, COUNT, and AVERAGE, while advanced DAX includes functions like CALCULATE, SUMX, USERELATIONSHIP, and DATESYTD that work with filter context, relationships, and business logic.
Why is CALCULATE so important in Power BI?
CALCULATE is the most powerful DAX function because it modifies filter context and allows users to apply business rules dynamically. Most advanced Power BI measures depend on CALCULATE for accurate results.
What is SUMX used for in Power BI?
SUMX is used for row-level calculations in Power BI. It evaluates each row individually before aggregating results, making it ideal for profit calculations, commissions, and transaction-based analysis.
How are DAX formulas used in real business dashboards?
DAX formulas are used in real dashboards for sales tracking, profit analysis, KPI monitoring, year-to-date reporting, regional performance comparison, and executive decision-making dashboards in companies.
Is DAX difficult for beginners?
DAX can feel difficult at first because of filter context and relationships, but it becomes easier with practice using real datasets and understanding business logic behind calculations.
Which DAX functions should I learn first?
Beginners should start with CALCULATE, SUMX, AVERAGEX, FILTER, RELATED, and basic time intelligence functions like DATESYTD before moving to advanced functions like TREATAS and CROSSFILTER.
Is learning DAX enough to become a Power BI developer?
No, DAX is only one part of Power BI. A developer also needs skills in data modeling, Power Query, dashboard design, and performance optimization for real-world business reporting.