Introduction
Working with Excel data is rarely straightforward. Whether you are handling sales reports, MIS data, or survey sheets, most datasets come with issues – missing values, inconsistent formats, duplicate entries, and messy structures.
For official documentation, you can refer to Microsoft Power Query Documentation .
Many Excel users spend hours fixing these problems manually. Even worse, the same cleaning process is repeated every time new data arrives.
This is exactly where Power Query in Excel becomes a powerful solution.
Power Query is designed to simplify and automate data cleaning. Instead of repeating tasks again and again, you can create a structured workflow that updates automatically with a single click.
In this guide, you’ll learn everything from what is Power Query in Excel to advanced features like Power Query concatenate columns, append multiple tables, fuzzy matching, and key functions used in real-world scenarios.
Power Query in Excel is a powerful tool used for data cleaning, transformation, and automation. It allows you to import data, apply step-by-step transformations, and refresh your workflow instantly without repeating manual tasks.
What is Power Query in Excel?
Power Query is a built-in Excel tool used for importing, cleaning, and transforming data from different sources.
In simple terms:
Power Query = Data Cleaning + Data Transformation + Automation
Instead of editing data manually, Power Query records every step you perform and allows you to reuse it whenever your data updates.
For example, if you receive a daily sales report that needs cleaning, you only need to set up the process once. After that, you simply refresh the data.
Why Power Query is Important for Excel Users
If you work with Excel regularly, you already know that most of your time is spent not on analysis, but on cleaning and preparing data. This is where Power Query in Excel becomes extremely important.
Power Query allows you to automate repetitive tasks such as removing duplicates, fixing formats, and standardizing data. Instead of performing the same steps again and again, you can create a workflow once and simply refresh it whenever new data is added.
Power Query is especially useful when combined with strong Excel skills. You can also explore Excel Skills for Data Analysis to strengthen your foundation.
Key Benefits of Power Query:
- Saves Time: Tasks that usually take hours can be completed in minutes with a simple refresh.
- Improves Accuracy: Reduces manual errors by applying consistent, automated steps.
- Handles Large Data Efficiently: Works smoothly even with large datasets.
- Combines Multiple Files: Easily merge and transform data from different sources.
- Supports Data Analysis Growth: Integrates with tools like Power BI for advanced analytics.
For professionals working in MIS reporting, sales analysis, or data-related roles, Power Query significantly improves productivity and workflow efficiency.
In simple terms, learning how to use Power Query in Excel helps you work smarter, reduce errors, and focus more on insights rather than repetitive manual tasks.
📊 When Should You Use Power Query?
- When working with messy or raw Excel data
- When combining multiple files (monthly/daily reports)
- When cleaning duplicate or inconsistent data
- When automating repetitive data tasks
- When preparing data for dashboards (Power BI / Excel)
How to Open Power Query in Excel
If you’re new to Power Query, the first step is knowing how to access it in Excel. The good news is that Power Query in Excel is built-in and easy to use.
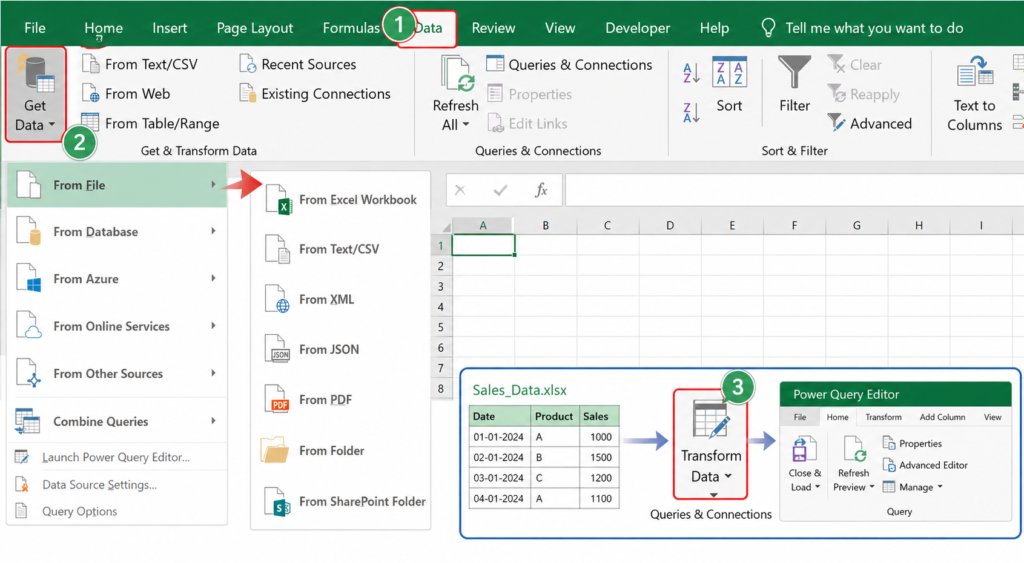
Steps to Open Power Query in Excel:
- Open Microsoft Excel
- Go to the Data tab on the top menu
- Click on Get Data
- Choose your data source (Excel file, CSV, Text, etc.)
- Click on Transform Data
Once you click on Transform Data, the Power Query Editor will open. This is where you can clean, transform, and prepare your data before loading it into Excel.
You can explore more advanced options in the official Excel Help Center .
Alternative Ways to Access Power Query:
- Click From Table/Range if your data is already in Excel
- Use Recent Sources to quickly reopen previously used files
- Connect to external sources like databases or online data
Power Query is available in Excel 2016 and later versions under the Data tab. If you’re using an older version, you may need to install it as an add-in.
Understanding Power Query Editor
The Power Query Editor is the main workspace where all data cleaning and transformation happens.
Once you load your data using Power Query in Excel, this editor opens automatically and allows you to modify your dataset before loading it back into Excel.
At first glance, it may look complex, but once you understand the layout, it becomes very easy to use.
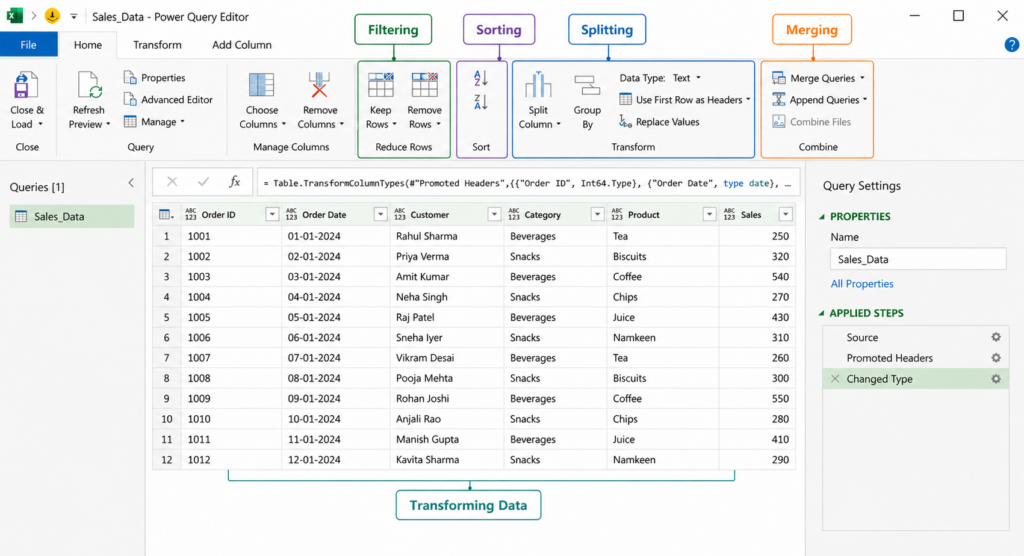
Key Sections in Power Query Editor:
1. Data Preview Area
This shows your dataset and updates in real time as you apply changes.
2. Applied Steps Panel
This is one of the most important sections. Every action you perform is recorded as a step. You can edit or remove any step at any time.
3. Toolbar Options
You will find multiple options for:
- Filtering
- Sorting
- Splitting
- Merging
- Transforming data
How to Use Power Query in Excel (Step-by-Step)
Once you understand the basics, the next step is learning how to use Power Query in Excelin a practical way. The process is simple and follows a structured workflow — import, clean, transform, and load.
Let’s go step by step.
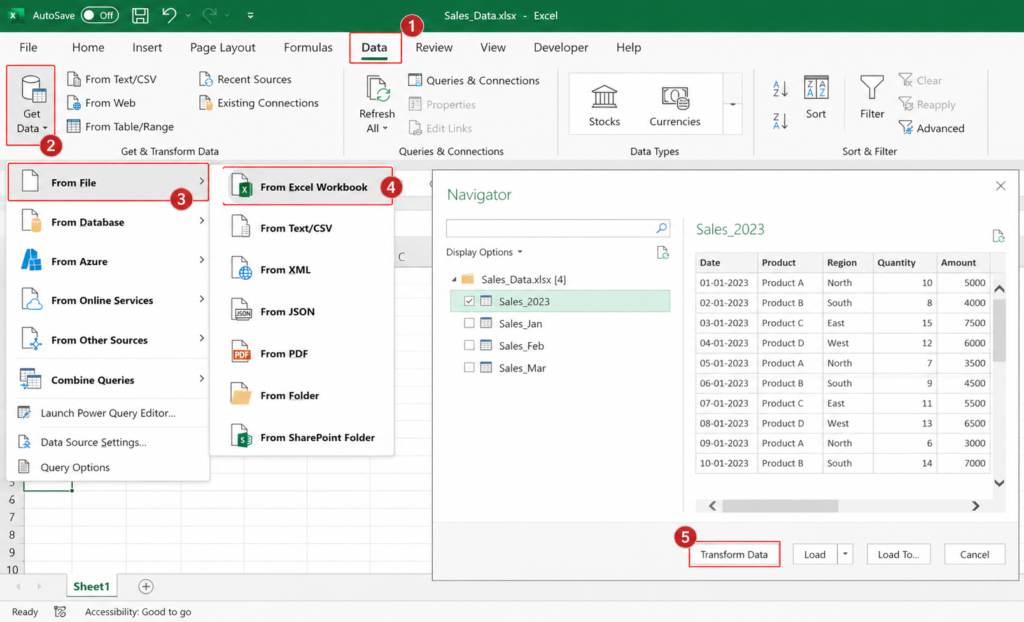
Step 1: Import Data into Power Query
Start by loading your data into Power Query.
Steps:
- Open Excel
- Go to the Data tab
- Click on Get Data
- Choose your data source (Excel file, CSV, Text, etc.)
- Click Transform Data
This will open the Power Query Editor.
Step 2: Clean Your Data
Once your data is loaded, the first task is cleaning it.
Common cleaning actions include:
- Removing blank rows
- Deleting unnecessary columns
- Fixing column headers
- Removing duplicate records
These steps help ensure your data is accurate and ready for analysis.
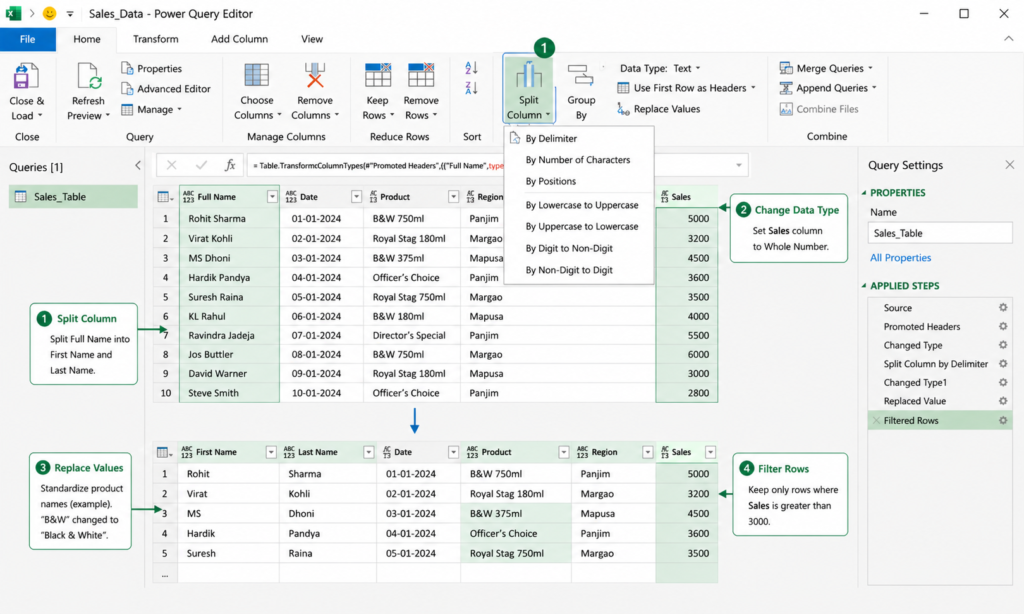
Step 3: Transform the Data
After cleaning, you can transform your data based on your requirements.
You can:
- Split columns (e.g., full name into first and last name)
- Merge columns (concatenate values)
- Change data types (text, number, date)
- Filter and sort data
Power Query automatically records each transformation step, making your workflow reusable.
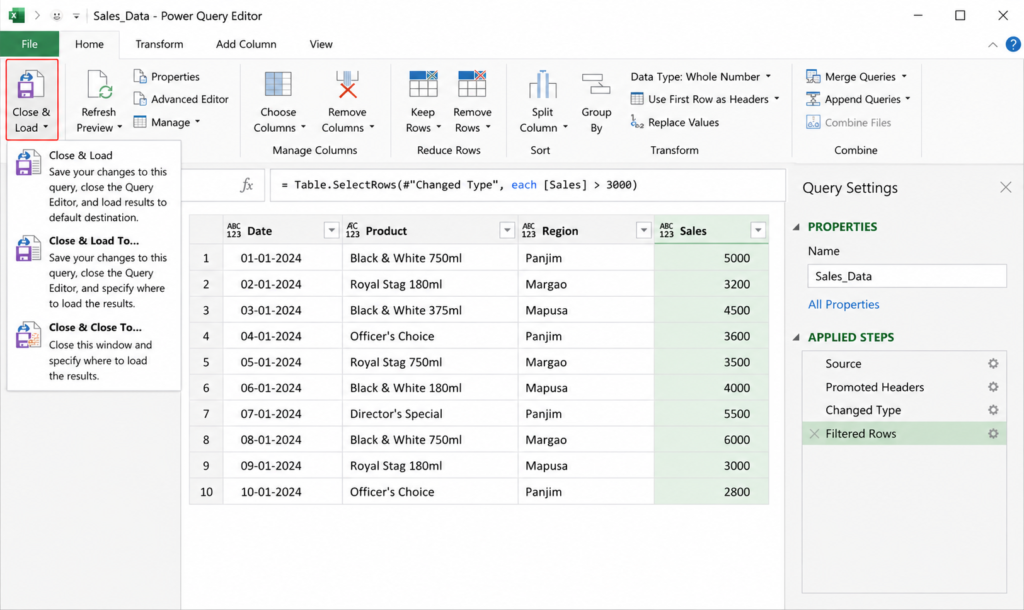
Step 4: Load Data Back to Excel
Once your data is ready:
- Click Close & Load
- Choose where to load the data (new sheet or existing sheet)
Your cleaned and transformed data will now appear in Excel.
Step 5: Refresh Data (Most Powerful Feature)
Whenever your source data updates, you don’t need to repeat the process.
Simply:
- Click Refresh
Power Query will automatically apply all the steps you created earlier.
Simple Power Query Workflow
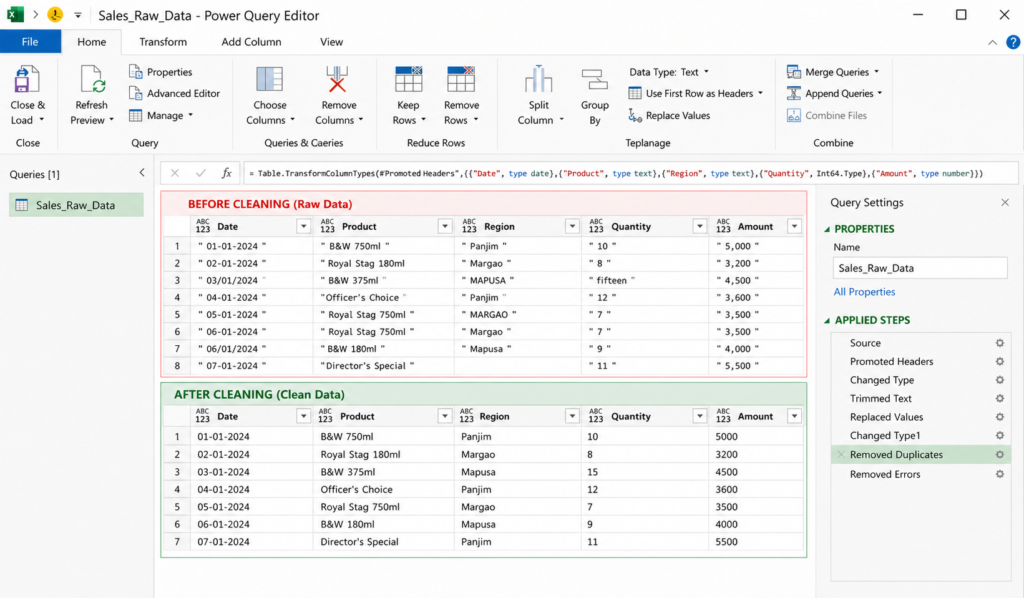
Real-World Example: Cleaning Sales Data
Imagine you receive daily sales data like this:
Problems:
- Same product written differently
- Inconsistent area names
- Data needs cleaning daily
Using Power Query, you can standardize names, remove duplicates, and automate the process.
Once set up, you just refresh the data — no need to repeat steps.
Power Query vs Power BI vs SQL
If you’re confused about tool selection, read our detailed comparison: Excel vs SQL vs Power BI .
Power Pivot vs Power Query
Power Query Concatenate Columns
In real-world Excel scenarios, combining multiple columns into one is a very common requirement. Whether it’s merging first and last names, creating unique IDs, or combining product details, this task becomes much easier using Power Query in Excel.
This process is often referred to as concatenate in Power Query.
When Do You Need to Concatenate Columns?
You may need to combine columns in situations like:
- Creating Full Name from First Name and Last Name
- Combining Area + Outlet Name for reporting
- Generating Product Descriptions
- Creating unique identifiers for datasets
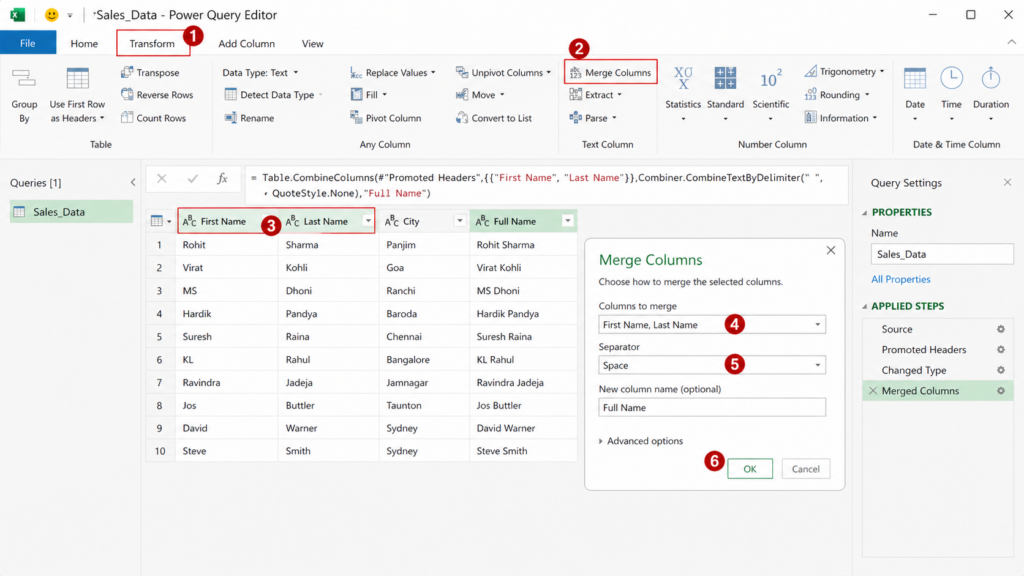
How to Concatenate Columns in Power Query
Follow these simple steps:
- Load your data into Power Query Editor
- Select the columns you want to combine
- Go to the Transform tab
- Click on Merge Columns
- Choose a separator (space, comma, dash, etc.)
- Click OK
Power Query will create a new column with combined values.
Example
Before Concatenation
After Concatenation
Using M Code for Concatenation (Advanced)
Behind the scenes, Power Query uses its own formula language (M language).
Here’s a simple example:
=Table.AddColumn(Source, “Full Name”, each [First Name] & ” ” & [Last Name])
This creates a new column by combining values with a space in between.
Pro Tips for Better Results
- Use a proper separator (space, hyphen, or comma)
- Clean text using Trim before merging
- Ensure column names are correct
- Avoid null values for better output
Power Query LEFT Function Explained
The Power Query LEFT function is used to extract a specific number of characters from the beginning of a text value. It is especially useful when working with structured data like product codes, IDs, or category prefixes.
While Excel uses formulas like LEFT(), Power Query performs this operation using its own transformation logic and M language functions.
When to Use LEFT Function in Power Query
You can use the LEFT function in scenarios such as:
- Extracting product prefixes (e.g., B&W from B&W 750ml)
- Getting area or region codes
- Shortening long text values
- Cleaning and standardizing data
How to Use LEFT Function in Power Query
Follow these steps:
- Open your data in Power Query Editor
- Go to the Add Column tab
- Click on Custom Column
- Enter a formula using the Text.Start function
- Click OK
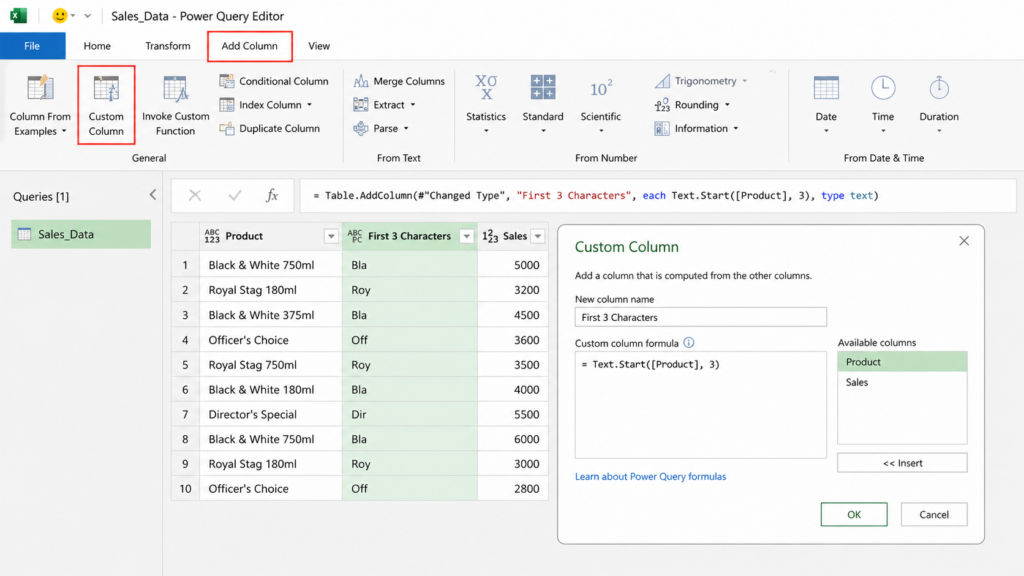
Tip: The Text.Start function in Power Query works like the LEFT function in Excel, allowing you to extract characters from the beginning of a text value.
Example
Let’s say you have a column:
You want to extract the first 3 characters.
M Code for LEFT Function
In Power Query, the LEFT function is written using Text.Start.
= Table.AddColumn(Source, “Prefix”, each Text.Start([Product], 3))
This creates a new column that extracts the first 3 characters from the Product column.
Pro Tips
- Ensure the column is in text format before applying the function
- Adjust the number of characters based on your requirement
- Combine with other transformations for better results
- Handle null values carefully to avoid errors
The Power Query LEFT function is a simple yet powerful tool for text manipulation. It helps you quickly extract meaningful parts of your data and improves consistency in reporting.
When used correctly, it can significantly reduce manual effort and make your data transformation process more efficient.
Power Query Append Multiple Tables
One of the most powerful features of Power Query in Excel is the ability to combine data from multiple tables or files into a single dataset. This process is known as append multiple tables.
It is especially useful when you receive data in separate files — such as daily, weekly, or monthly reports — and need to consolidate everything into one place for analysis.
When Do You Need to Append Tables?
You can use this feature in scenarios like:
- Combining monthly sales reports into one dataset
- Merging daily outlet data for MIS reporting
- Consolidating data from multiple Excel files
- Preparing data for dashboards or analysis
Instead of manually copying and pasting data, Power Query automates the entire process.
How to Append Multiple Tables in Power Query
Follow these steps:
- Load all required tables into Power Query Editor
- Go to the Home tab
- Click on Append Queries
- Choose:
- Two tables, or
- Three or more tables
- Select the tables you want to combine
- Click OK
Power Query will combine all selected tables into a single dataset.
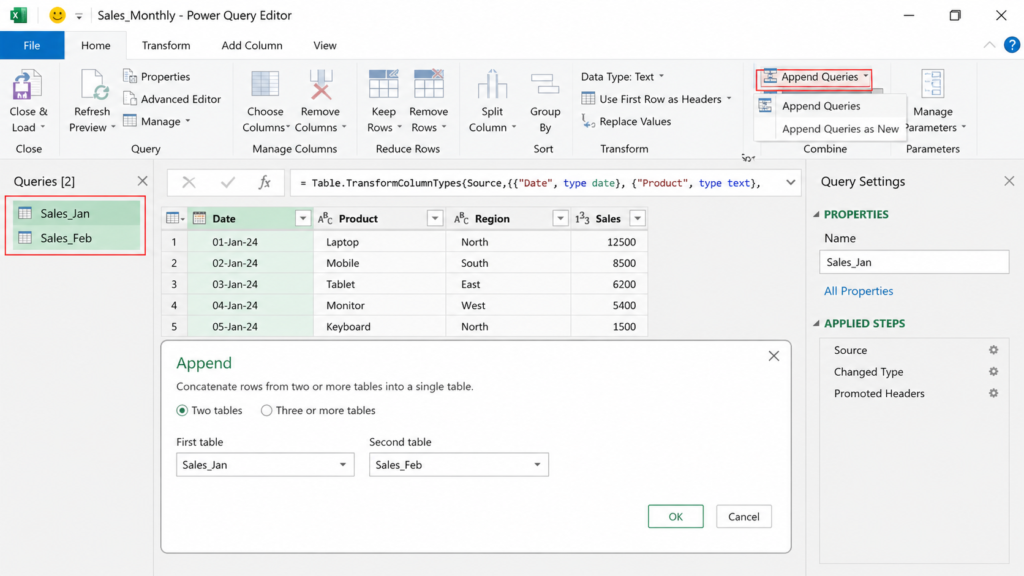
Example
You have three separate files:
- January Sales
- February Sales
- March Sales
After appending:
👉 All data is combined into one table with consistent structure.
Using M Code for Appending Tables (Advanced)
Behind the scenes, Power Query uses M language to combine tables.
= Table.Combine({Jan, Feb, Mar})
This command merges multiple tables into a single dataset.
Pro Tips for Best Results
- Ensure all tables have the same column structure
- Keep column names consistent across files
- Clean each dataset before appending
- Avoid unnecessary columns to keep data optimized
The Power Query append multiple tables feature eliminates the need for manual consolidation and significantly improves efficiency.
Once your setup is complete, you can simply add new files and click Refresh – Power Query will automatically include the latest data.
For MIS reporting and data analysis, this feature alone can save hours of repetitive work.
Merge Queries (Like SQL JOIN)
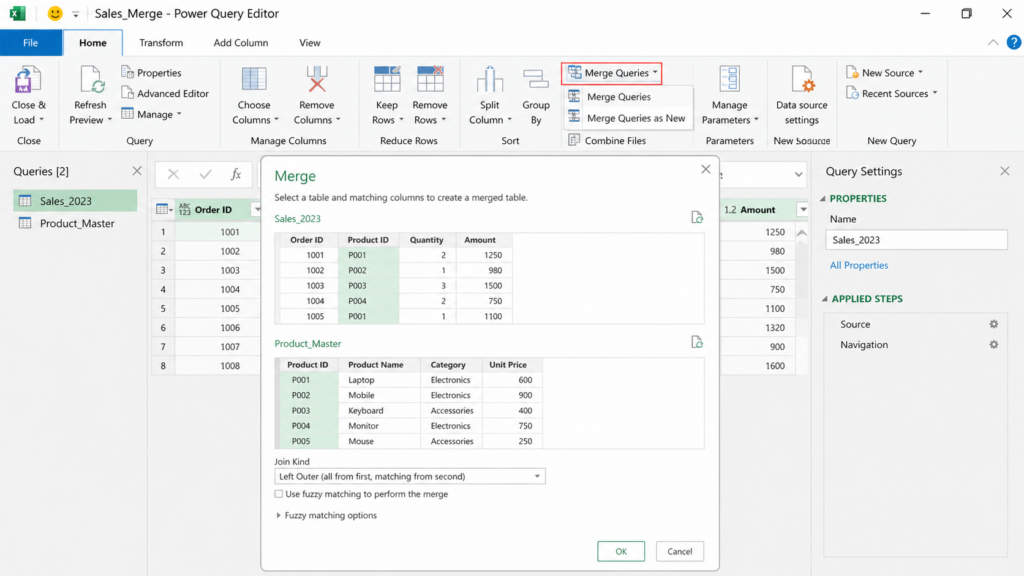
The Merge Queries feature in Power Query in Excel allows you to combine data from two tables based on a common column. It works similarly to SQL JOIN, making it very useful when your data is split across multiple sources.
You can use Merge Queries in scenarios like:
- Combining sales data with product details
- Linking outlet data with region information
- Joining customer data with transactions
Power Query matches rows from both tables using a common field such as Product ID, Outlet Name, or Customer ID, and then adds related data into one table.
How to Merge Queries in Power Query:
- Load both tables into Power Query Editor
- Go to the Home tab
- Click Merge Queries
- Select the second table
- Choose matching columns in both tables
- Select the join type (Inner, Left, etc.)
- Click OK and expand required columns
💡 Key Tip
Make sure both columns have the same data type to avoid errors while merging in Power Query.
Fuzzy Matching in Power Query
Fuzzy Matching in Power Query is a powerful feature that helps you match similar values instead of exact matches. It is especially useful when working with messy or inconsistent data, where names or entries are slightly different but refer to the same thing.
For example:
- Panjim and Panaji
- B&W and Black & White
- Goa City and Goa
In such cases, a normal match would fail, but fuzzy matching identifies the closest possible match.
When to Use Fuzzy Matching
You can use this feature when:
- Data contains spelling variations
- Names are not standardized
- You are merging data from different sources
How to Use Fuzzy Matching in Power Query
- Load both tables into Power Query Editor
- Go to Home → Merge Queries
- Select matching columns
- Enable Use Fuzzy Matching
- Click OK
Power Query will match similar values based on similarity rules.
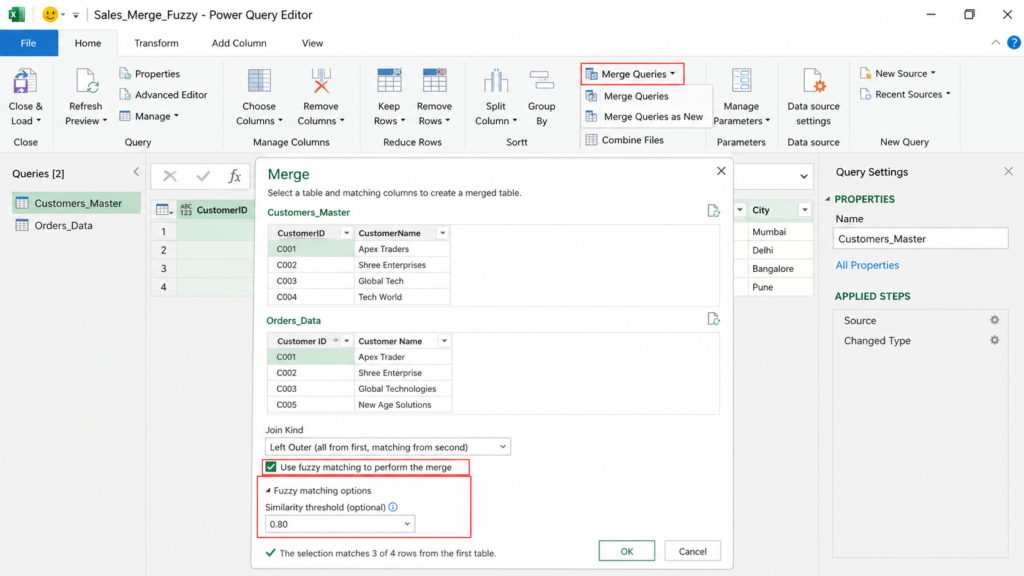
💡 Key Tip
You can adjust matching settings like similarity threshold to improve accuracy when using fuzzy matching in Power Query.
Advanced Transformations in Power Query
Once you understand the basics, Power Query in Excel offers advanced transformations that help you handle complex data scenarios efficiently.
These features go beyond simple cleaning and allow you to reshape and analyze data in a structured way.
You can also combine Power Query with SQL techniques: SQL for Data Analysis .
Common Advanced Transformations
- Split Columns: Break a single column into multiple parts (e.g., full name into first and last name)
- Merge Columns: Combine multiple columns into one using separators
- Filter Rows: Extract only relevant data based on conditions
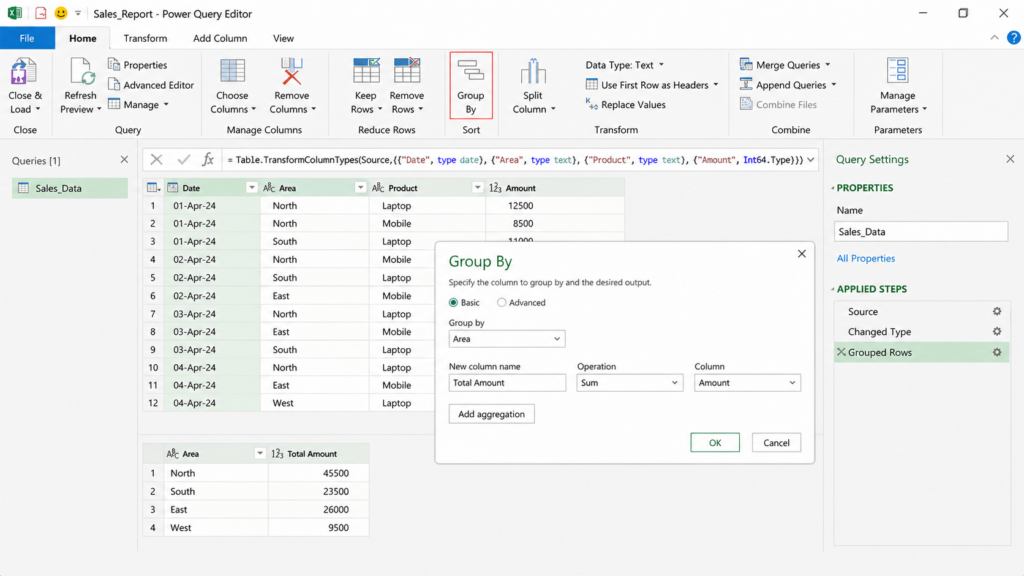
- Group By: Summarize data (e.g., total sales by area)
- Pivot / Unpivot: Restructure data layout for better analysis
- Change Data Types: Convert text to numbers, dates, or other formats
Example Use Case
In sales reporting, you can:
- Group data by Area
- Calculate total Amount
- Filter high-performing regions
This helps create quick summaries without using complex formulas.
💡 Key Tip
Always keep your transformation steps simple and organized using the Applied Steps panel. This ensures your workflow remains easy to manage, reusable, and error-free.
⚠️ Common Mistakes to Avoid in Power Query
While using Power Query in Excel, beginners often make small mistakes that can lead to incorrect results or errors. Here are some common ones you should avoid:
Not setting correct data types (text, number, date) can break calculations and filtering.
Many users don’t review applied steps, which leads to confusion and errors in workflow.
Always keep raw data unchanged. Work on transformed queries instead.
Leaving default step names makes your query difficult to understand later.
Loading unnecessary columns or steps can slow down your reports significantly.
Real MIS Use Case (Practical Scenario)
Let’s take a real scenario.
You receive daily sales data from different outlets.
Tasks:
- Combine multiple files
- Clean product names
- Remove duplicates
- Generate summary
Using Power Query, you can automate the entire process.
What used to take 2–3 hours can now be done in minutes.
From my experience working as an MIS executive, I often receive daily sales files that require repetitive cleaning. This is where Power Query becomes extremely useful.
This is similar to real workflows used by MIS professionals. Read how it works in real life: My Daily Workflow as an MIS Executive.
Real Insight: This workflow is commonly used in MIS reporting, sales analytics, and business dashboards.
Tips to Master Power Query Faster
- Practice with real datasets
- Understand basic transformations
- Learn how applied steps work
- Avoid overcomplicating processes
Consistency is more important than complexity.
To practice these transformations, you can download real datasets from Kaggle .
Future Scope of Power Query
Power Query is becoming an essential skill in:
- Data analytics
- Business intelligence
- Automation workflows
It integrates with tools like Power BI, SQL Server, and Power Automate.
Learning Power Query now will give you a strong advantage in your career.
Learning Power Query can help you transition into analytics roles. Check: MIS to Data Analyst Transition Guide .
Final Thoughts
Power Query is one of the most powerful tools available in Excel today. It simplifies data cleaning, improves efficiency, and helps you build automated workflows.
If you want to grow in your career – especially in data-related roles – learning Power Query is a smart investment.
Once you start using it regularly, you’ll realize how much time you can save and how much more efficient your work can become.
🚀 Want to Become a Data Analyst?
Power Query is just the beginning. Learn Excel, SQL, and Power BI step-by-step to build real-world data skills.
📊 Explore Data Analyst RoadmapFrequently Asked Questions
Clear answers to common questions about Power Query in Excel, data cleaning, transformations, merge queries, append queries, and automation.
What is Power Query in Excel?
Power Query in Excel is a tool used to import, clean, and transform data from different sources. It helps automate repetitive tasks and prepares data for analysis and reporting.
How do I open Power Query in Excel?
You can open Power Query from the Data tab by clicking Get Data and selecting your data source, then choosing Transform Data to open the Power Query Editor.
What is Power Query Editor used for?
Power Query Editor is used for cleaning, filtering, sorting, splitting, merging, and transforming raw data before loading it back into Excel.
What is the difference between Merge Queries and Append Queries?
Merge Queries combines tables based on a common column (like SQL JOIN), while Append Queries combines tables by stacking rows from one table below another.
Is Power Query better than Excel formulas for data cleaning?
Yes, Power Query is more efficient for data cleaning because it allows you to automate transformations and refresh data without repeating manual steps.
Can Power Query handle large datasets?
Yes, Power Query can handle large datasets better than traditional Excel methods by optimizing data processing and reducing manual workload.
Is Power Query useful for data analyst jobs?
Yes, Power Query is an essential skill for data analysts as it helps in data cleaning, preparation, and automation, which are key parts of real-world data analysis workflows.