Last Updated: May 2026
🔬 This article is part of my Real Data Lab series, where I work on real-world datasets and show how raw data is cleaned, analyzed, and converted into meaningful business insights. This is exactly how real MIS and Data Analyst work happens in companies.
Customer Segmentation Analysis in Excel (Real Dataset Project)
Customer segmentation analysis in Excel is a powerful technique that helps businesses divide customers into meaningful groups based on their behavior and spending patterns.
Customer data is available in almost every business, but very few companies actually use it effectively. In many cases, all customers are treated the same, which leads to missed opportunities in marketing, sales, and long-term retention.
Customer segmentation helps solve this problem by dividing customers into meaningful groups based on their behavior, spending patterns, and purchase frequency. Instead of looking at raw numbers, it allows businesses to identify high-value customers and understand where improvements are needed.
In this Real Data Lab project, I worked on a practical dataset and segmented customers based on:
- Age group
- Spending behavior
- Purchase frequency
I then converted this data into a simple dashboard to extract actionable insights.
This is exactly the type of analysis I perform in my daily MIS reporting work in Excel, where raw data is transformed into clear business decisions.
Let’s start by understanding the dataset used in this analysis.
Dataset Overview (Real Business Structure)
The dataset used in this project is simple but highly effective for analysis. This dataset is ideal for performing customer segmentation analysis in Excel using real-world data.
Columns Included:
- Customer ID
- Age
- City
- Purchase Amount
- Number of Purchases
- Last Purchase Date
This type of dataset is commonly used in:
- FMCG companies (daily sales tracking)
- Retail outlets
- E-commerce platforms
- CRM systems
From my experience in MIS reporting, this is the kind of data you will see in almost every organization.
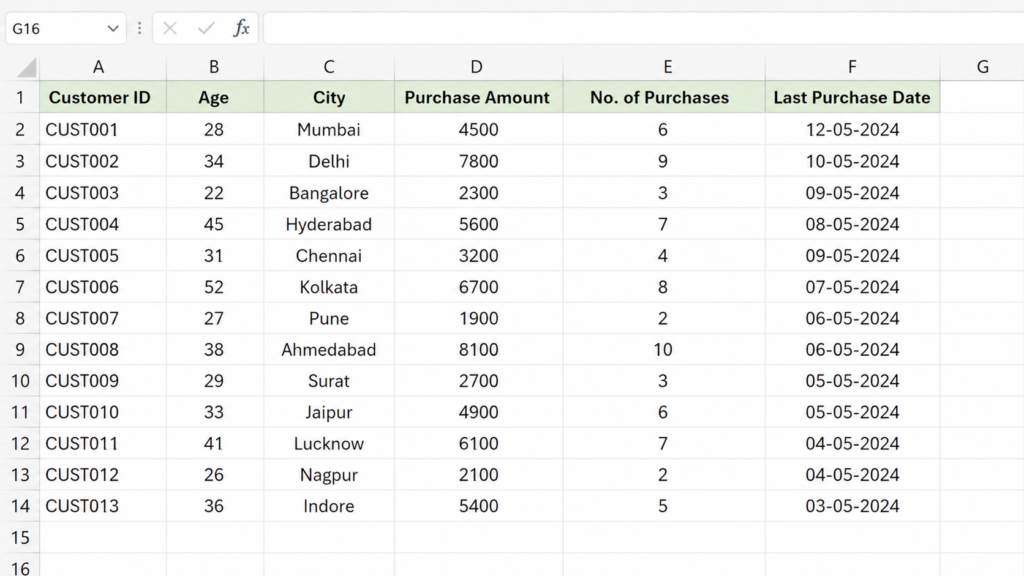
Sample customer dataset used for segmentation analysis in Excel
This is the raw dataset before applying any segmentation logic.
Step-by-Step Customer Segmentation Process in Excel
Step 1: Data Cleaning (Most Important Step)
Before starting any analysis, I always focus on cleaning the data.
Because even a small error in data can lead to completely wrong insights.
Cleaning Steps I Performed:
- Removed duplicate customer entries
- Checked for blank or missing values
- Standardized city names (e.g., Mumbai vs mumbai)
- Converted date columns into proper format
Why This Matters:
If you skip this step:
- Your dashboard will show wrong numbers
- Insights will be misleading
- Decision-making will fail
In real jobs, data cleaning is often 50–60% of the work.
If you are still learning Excel basics, I highly recommend going through this guide on essential Excel skills for data analysis to build a strong foundation.
Step 2: Creating Customer Segments (Core Logic)
This step is the core part of customer segmentation analysis in Excel, where raw data is converted into meaningful categories.
Instead of analyzing raw numbers, I converted the data into categories.
This makes the analysis more meaningful and easy to understand.
Age-Based Segmentation
Customers were grouped into:
- 18–25 → Young Customers
- 26–35 → Working Professionals
- 36–50 → Mature Customers
- 50+ → Senior Customers
Excel Formula Used:
=IF(B2<=25,”Young”,IF(B2<=35,”Working”,IF(B2<=50,”Mature”,”Senior”)))
Why This Is Useful:
Different age groups behave differently:
- Young customers may try new products
- Working professionals spend more
- Mature customers prefer stability
You can also explore detailed explanations of Excel formulas from Microsoft’s official Excel documentation.
Spending-Based Segmentation
Customers were categorized based on purchase value:
- High Value → Above ₹5000
- Medium Value → ₹2000–₹5000
- Low Value → Below ₹2000
Why This Matters:
In most businesses:
👉 20% customers generate 70% revenue
So identifying high-value customers is critical.
Frequency-Based Segmentation
Based on purchase frequency:
- Frequent Buyers
- Occasional Buyers
- One-Time Buyers
| Segment Type | Category | Business Use |
|---|---|---|
| Age | Young / Working / Mature | Targeted marketing |
| Spending | High / Medium / Low | Revenue optimization |
| Frequency | Frequent / Occasional | Retention strategy |
After applying segmentation logic, the dataset looks like this:
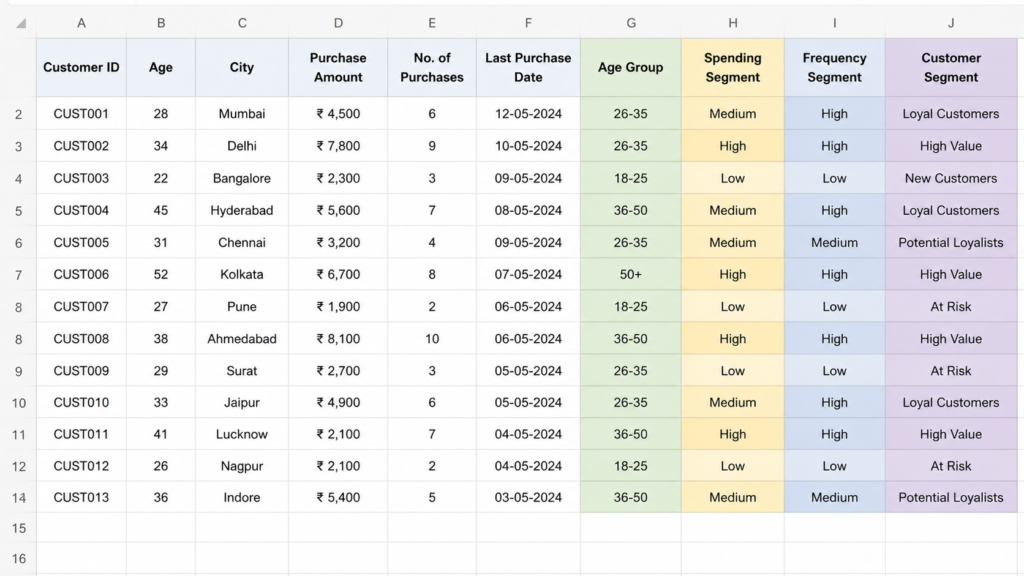
Customer segmentation applied in Excel using age group, spending behavior, and purchase frequency
Real Insight:
From my experience:
- One-time buyers are usually very high
- But converting them into repeat customers is the real challenge
If you want to practice with more real datasets, you can explore platforms like Kaggle datasets.
Step 3: Dashboard Creation in Excel
After segmentation, I created a dashboard to visualize insights.
Tools Used:
- Pivot Tables
- Bar Charts
- Pie Charts
- Slicers
Dashboard Components
1️⃣ Revenue by Segment
Shows how much each group contributes.
2️⃣ Customer Distribution
Shows number of customers in each category.
3️⃣ Age Group Analysis
Identifies most active age group.
4️⃣ City Performance
Highlights top-performing cities.
Why Dashboard Is Important:
Raw data = confusion
Dashboard = clarity
- 👉 Decision-makers never read raw Excel sheets.
- 👉 They rely on dashboards.
After building the dashboard, the final output looks like this:
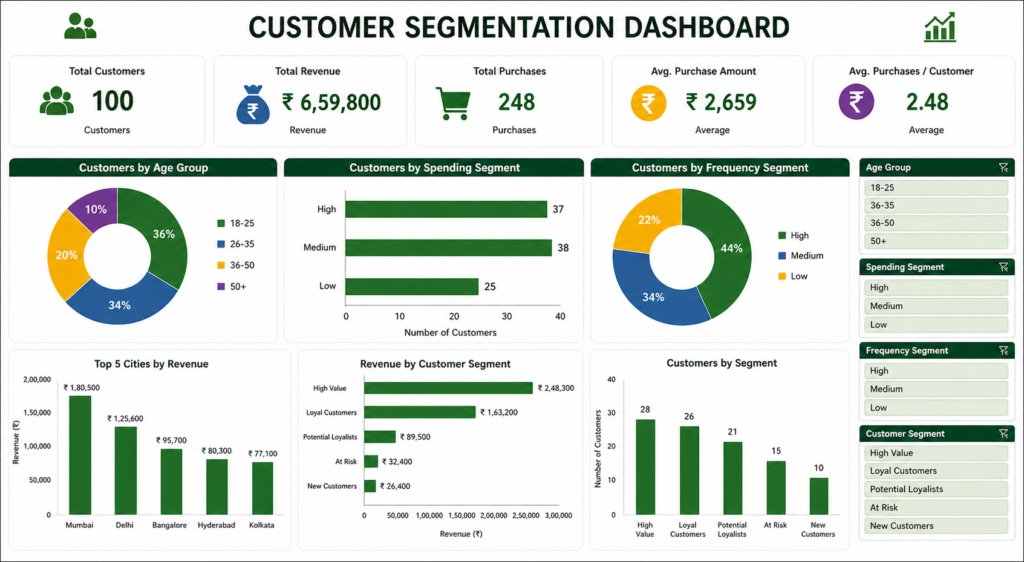
Final Excel dashboard showing customer segmentation insights, KPIs, and performance analysis
📥 Download Dataset & Dashboard
You can download the dataset and Excel dashboard used in this project.
Download FilesTo understand this better, you can explore my detailed guide on how to convert raw data into professional MIS dashboards.
Once the dashboard was ready, the next step was to extract meaningful insights from the data.
Key Insights from This Analysis
The key insights from the analysis can be visualized as follows:
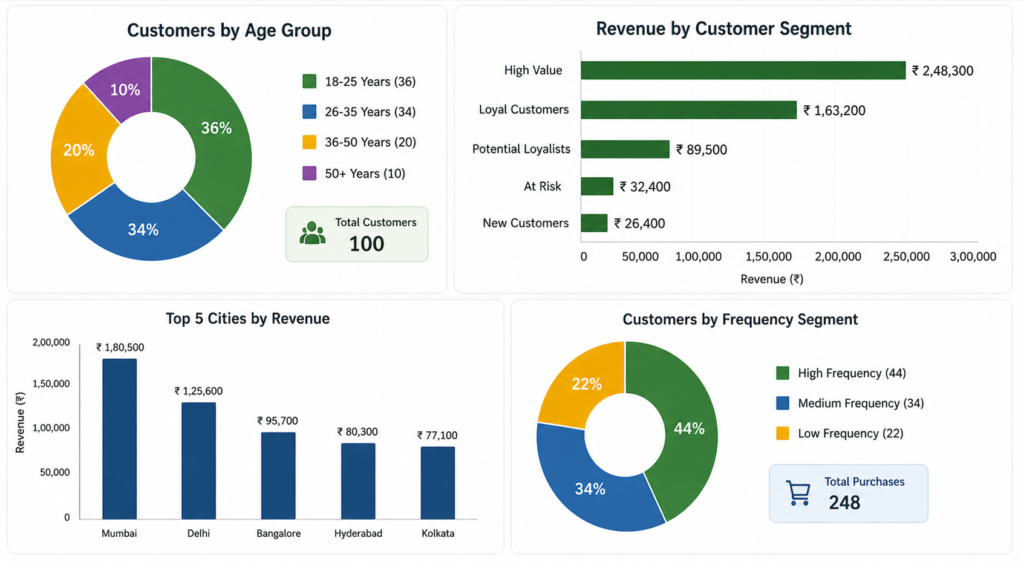
Charts representing key insights such as revenue contribution, customer segments, and city-wise performance
These insights help businesses take data-driven decisions instead of relying on assumptions.
Customer segmentation is widely used in marketing strategies, as explained in detail on Investopedia.
After building the dashboard, these were the most important findings:
1. High-Value Customers Drive Revenue
A small percentage of customers contributed nearly 65% of total revenue.
This means:
- Business should focus more on these customers
- Special offers can be given to retain them
2. Age Group 26–35 Is Most Active
This group had:
- Highest purchase frequency
- Consistent spending
Ideal target for promotions.
3. High Number of One-Time Buyers
Many customers purchased only once.
This indicates:
- Weak customer retention
- Need for follow-up strategies
4. City-Level Performance Gap
Some cities performed significantly better.
Helps in:
- Regional marketing
- Sales planning
How Businesses Use This Analysis
Customer segmentation is widely used in:
- Targeted advertising
- Loyalty programs
- Personalized offers
- Customer retention campaigns
This is why companies always look for analysts who understand segmentation.
To understand how this works in a practical scenario, let’s look at a real-world example.
Real-World Example of Customer Segmentation
Let’s understand how this works in a real business scenario.
Imagine a retail company analyzing customer purchase data. After segmentation:
- High-value customers are targeted with premium offers
- Frequent buyers receive loyalty rewards
- One-time buyers are targeted with discounts
This helps increase revenue and improve customer retention.
This is exactly how companies use segmentation in real-world decision-making.
Why This Project Is Important for Your Career
If you are learning data analytics, this type of project:
- Builds practical skills
- Improves your resume
- Helps in interviews
- Shows real experience
Interview question example:
“Explain a project where you segmented customers.”
Now you have a real answer.
If your goal is to become a data analyst, follow this complete data analyst career roadmap to understand the skills and steps required.
Common Mistakes in Customer Segmentation
Customer segmentation can provide powerful insights, but many beginners make common mistakes while working with data.
Some of the most common mistakes include:
- Ignoring data cleaning before segmentation
- Creating too many unnecessary segments
- Not linking segmentation with business decisions
- Using incorrect formulas or assumptions
- Focusing only on data and ignoring insights
Avoiding these mistakes helps you create more accurate and useful analysis.
What Should You Do Next?
Now that you understand customer segmentation, the next step is to practice with real datasets and build more projects.
You can:
- Create your own Excel dashboards
- Work on sales or inventory datasets
- Learn SQL for advanced analysis
- Practice visualization using Power BI
The more you practice, the better your data analysis skills will become.
In simple terms, customer segmentation helps turn raw data into clear and actionable business decisions.
Conclusion
Customer segmentation is not just a theoretical concept – it is a practical skill used daily in real business environments.
In this Real Data Lab project, we transformed raw customer data into meaningful insights using Excel, segmentation logic, and dashboard visualization. This is exactly the type of work expected from data analysts and MIS professionals.
If you want to grow in this field, focus on building real projects like this instead of only learning theory. That is what truly makes you job-ready.
Customer segmentation analysis in Excel is an essential skill for anyone working in data analysis or MIS reporting.
Frequently Asked Questions
Clear answers to common questions about customer segmentation analysis in Excel, dashboard creation, and real-world data analyst work.
What is customer segmentation in Excel?
Customer segmentation in Excel means dividing customers into groups based on age, spending behavior, and purchase frequency using formulas, pivot tables, and dashboards. It helps businesses understand customer patterns and make better decisions.
Which Excel functions are used for customer segmentation?
Common Excel functions used for segmentation include IF formulas for categorization, VLOOKUP or XLOOKUP for mapping values, and pivot tables for summarizing grouped data effectively.
Is Excel enough for customer segmentation analysis?
Yes, Excel is enough for basic to intermediate segmentation analysis. Many companies use Excel for MIS reporting and dashboards. For advanced analysis, tools like SQL and Power BI are also used.
Why is customer segmentation important for businesses?
Customer segmentation helps businesses identify high-value customers, improve marketing strategies, increase retention, and personalize offers based on customer behavior.
How is customer segmentation used in real jobs?
In real jobs, analysts use segmentation to track customer behavior, create dashboards, support decision-making, and provide insights for marketing and sales teams.
Can I add this project to my data analyst resume?
Yes, this type of real data project is highly valuable for resumes. It demonstrates practical skills, problem-solving ability, and real-world experience, which are important for data analyst roles.
What skills can I learn from this project?
You can learn data cleaning, segmentation logic, Excel formulas, dashboard creation, and how to convert raw data into meaningful business insights.