Introduction
How to design MIS reports is a common question for professionals working with business data, reporting, and management support roles. A well-designed MIS report helps organizations track performance, analyze trends, and make better business decisions using Excel dashboards, tables, and KPIs.
Sales, HR, and Finance teams rely on MIS reports to monitor targets, workforce metrics, expenses, and profitability.
Many companies collect business data daily, but not every company knows how to convert that data into useful decisions. That is where MIS reports become valuable.
In many organizations, MIS reports are the backbone of operational decision-making because they provide structured insights about different business functions.
Departments such as sales, human resources, and finance rely heavily on reporting systems to monitor:
- Performance
- Track targets
- Operational efficiency
These reports help managers understand what is happening inside the organization and where improvements are needed.
However, one common problem in many companies is that different departments create their reports independently.
- Sales teams track revenue in one report .
- HR departments maintain employee data in another.
- Finance teams analyze expenses separately.
When these reports are not connected, it becomes difficult for management to see the bigger picture.
If you are just starting your data learning journey and feeling confused about where to begin, you may also find it helpful to read 8 Reasons Most Beginners Fail to Learn Data Analytics Skills.
In this guide, we will learn how to design MIS reports in Excel for Sales, HR, and Finance teams step by step.
To design MIS reports in Excel, define the objective, collect clean data, choose KPIs, create structured tables, add charts, build a dashboard, and review the report regularly. Sales, HR, and Finance teams use different metrics but follow the same reporting framework.
Why MIS Reports Matter in Every Business
MIS reports are not just spreadsheets. They are decision-making tools used by managers and business leaders.
- Track targets and performance
- Monitor department productivity
- Reduce reporting confusion
- Find business problems early
- Improve planning with real data
Understanding the Purpose of MIS Reports
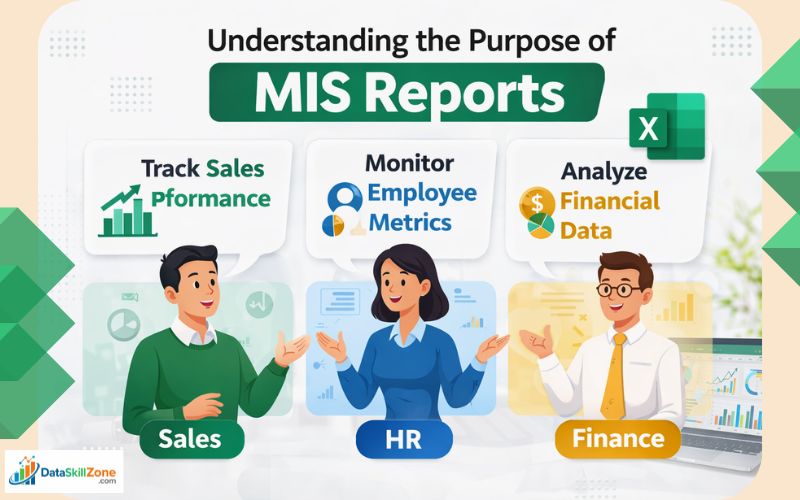
Before you design MIS reports, it is important to understand the purpose of the report.
Designing MIS reports that combine insights from multiple departments helps organizations improve visibility and make better strategic decisions.
When data from sales, HR, and finance is structured properly, leaders can quickly understand business performance and identify opportunities for growth.
Before learning how to design MIS reports, it is important to understand why organizations rely on them.
MIS stands for Management Information System, and MIS reports are structured summaries of data that help management monitor performance and make decisions.
These reports collect information from different sources and present it in a clear and organized format.
MIS reports are used by managers to:
- track business performance
- monitor operational activities
- analyze department productivity
- identify trends and patterns
- support strategic decision-making
For example,
- A sales manager may review an MIS report to see monthly revenue trends.
- while an HR manager may analyze employee attrition data.
- Finance teams may use MIS reports to track expenses and profitability.
When these reports are designed correctly, they help management quickly understand what is working well and what needs improvement.
7 Steps to Design MIS Reports in Excel
Define the reporting objective
Collect accurate raw data
Clean and structure the data
Select the right KPIs
Create tables and charts
Build a summary dashboard
Review and update the report regularly
Key Elements of a Well-Designed MIS Report
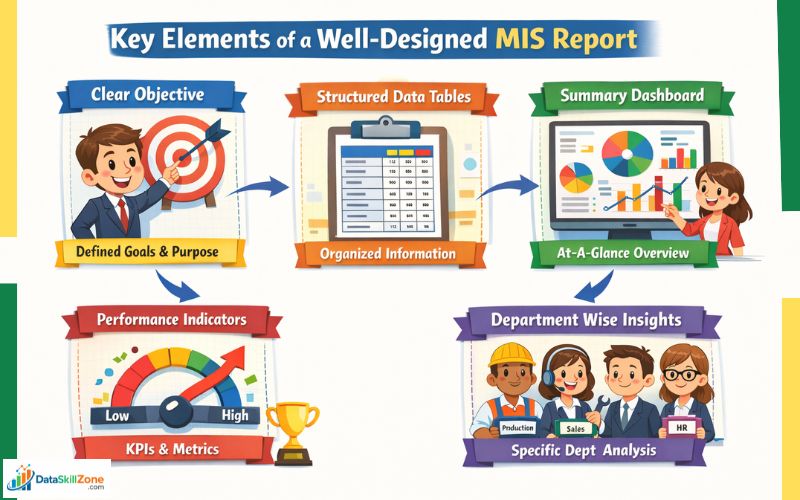
To design MIS reports effectively, certain key elements must be included.
A good MIS report should be clear, structured, and easy to interpret.
The main components of an effective MIS report include:
1. Clear Reporting Objective
Every MIS report should have a defined purpose. The report should answer a specific business question such as:
- How much revenue was generated this month?
- What is the employee attrition rate?
- Are expenses within budget?
A clear objective ensures the report remains focused.
2. Structured Data Tables
Data should be organized into structured tables so that it is easy to analyze and interpret.
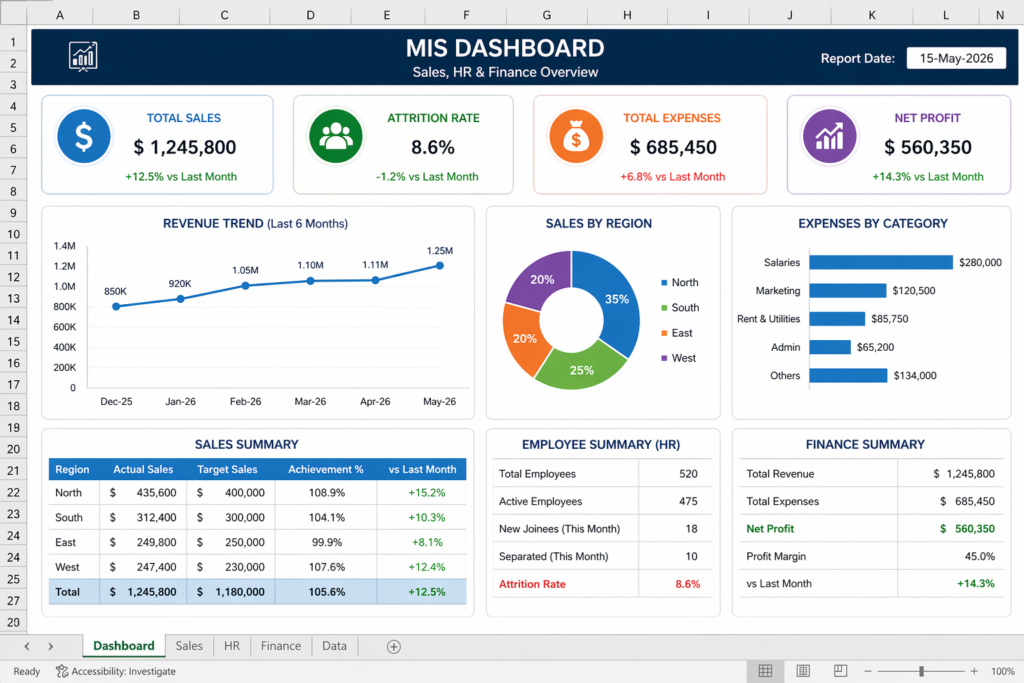
3. Summary Dashboard
Many MIS reports include summary dashboards that provide a quick overview of key metrics.
4. Performance Indicators
Key performance indicators (KPIs) should be included to measure department performance.
5. Department-Wise Insights
Reports should provide insights for different departments so that managers can analyze performance separately.
These components are essential when learning how to design MIS reports that are clear, useful, and easy to update.
When these elements are combined, MIS reports become powerful tools for decision-making.
These report design techniques are commonly used in the daily workflow of an MIS executive when preparing reports for management.
Designing MIS Reports for Sales Teams

Sales departments rely heavily on data to monitor revenue performance and track targets.
A sales MIS report usually includes several important metrics that help managers evaluate sales performance.
If you want to know how to design MIS reports for sales teams, focus on revenue trends, targets, and regional performance metrics.
Common metrics included in sales MIS reports are:
- Daily sales data
- Monthly revenue trends
- Product performance analysis
- Regional sales comparison
- Sales target vs achievement
- New customer acquisition
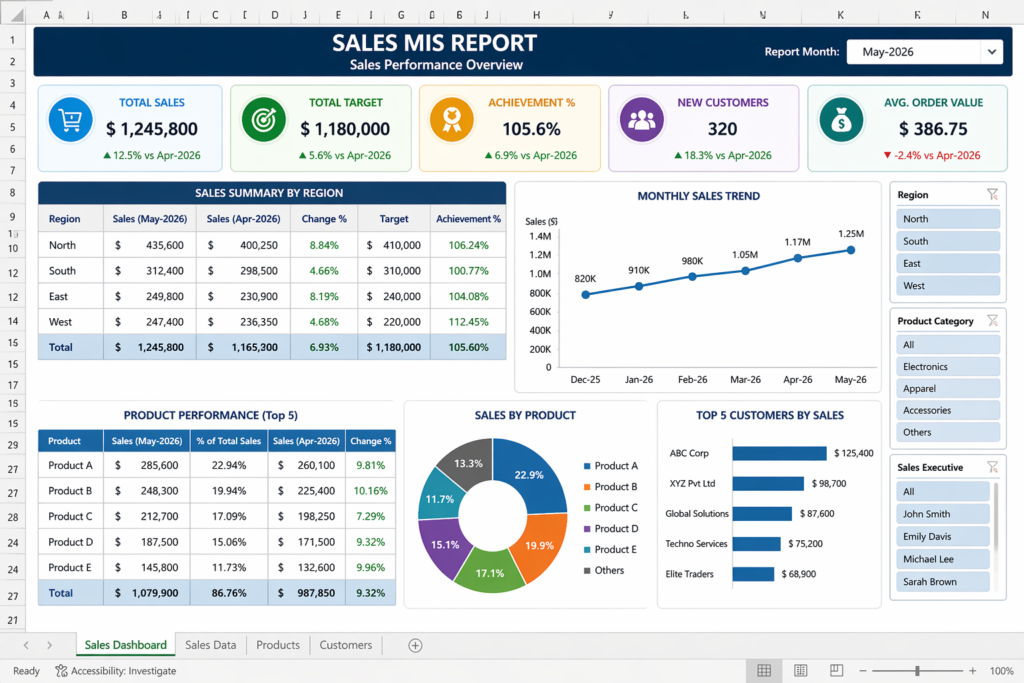
These metrics help sales managers identify which products are performing well and which markets require attention.
For example,
- If sales data shows that one region is consistently outperforming others, management may focus marketing efforts in that area.
- On the other hand, poor sales performance may indicate the need for additional support or training.
Sales MIS reports also help companies track long-term trends and forecast future revenue.
Designing MIS Reports for HR Departments

Human resources departments also rely on MIS reporting to monitor workforce performance and manage employee data.
HR MIS reports usually focus on workforce metrics and employee management.
Professionals learning how to design MIS reports for HR should include attendance, attrition, hiring, and payroll insights.
Common HR metrics include:
- employee attendance records
- employee attrition rate
- recruitment statistics
- employee performance evaluations
- payroll summaries
- training and development metrics
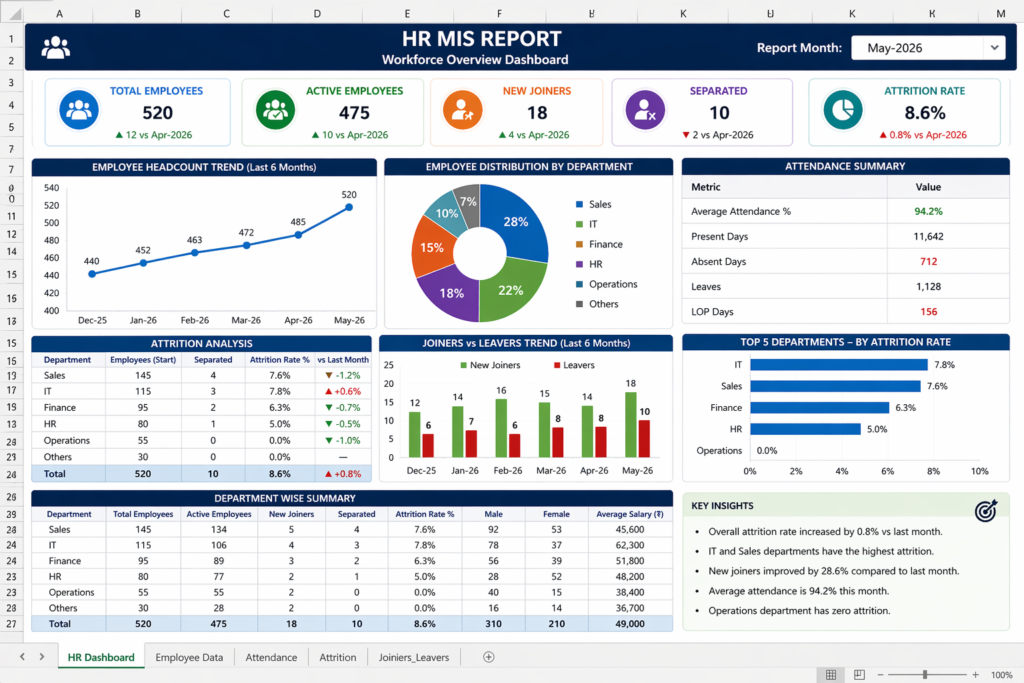
These reports help HR teams understand workforce trends and make better hiring decisions.
For example, a high attrition rate in a specific department may indicate employee dissatisfaction or workload imbalance.
HR managers can analyze the data and implement strategies to improve retention.
MIS reporting also helps HR departments track hiring performance and ensure that staffing levels meet organizational requirements.
Designing MIS Reports for Finance Teams

Finance departments depend on MIS reports to track the financial health of the organization.
Financial MIS reports usually focus on revenue, expenses, and profitability.
To understand how to design MIS reports for finance teams, track revenue, expenses, profit margins, and budget variance.
Key finance metrics include:
- revenue and income analysis
- expense tracking
- profit margin calculations
- budget vs actual comparison
- cost analysis reports
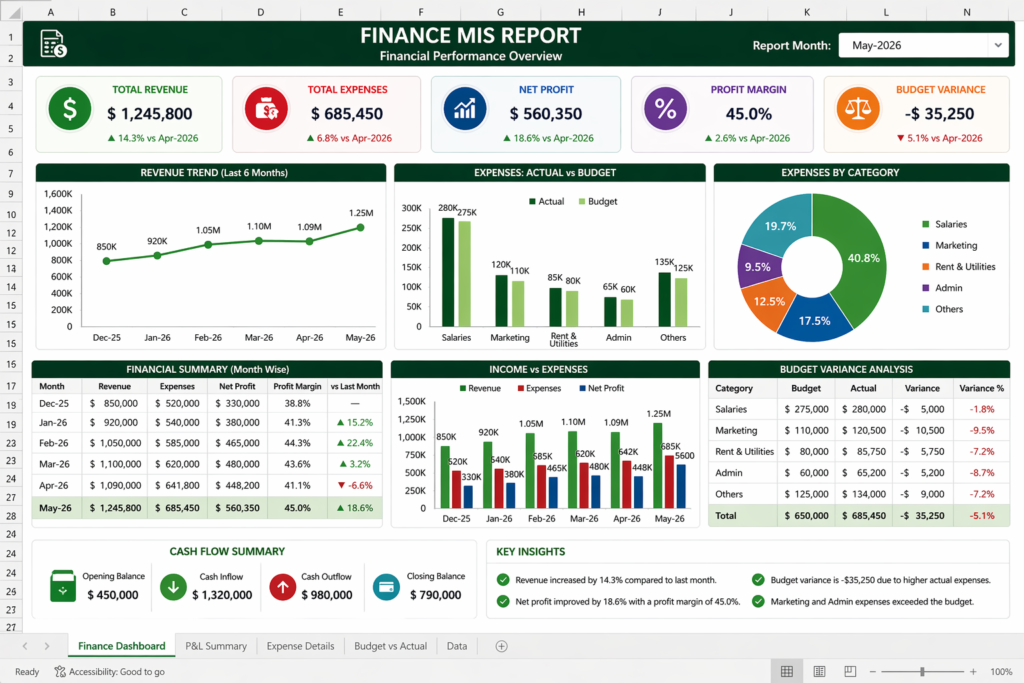
These reports allow finance managers to monitor how money flows within the organization.
For example, if expenses increase significantly in a particular department, finance teams can investigate the cause and recommend corrective measures.
Financial MIS reports also help organizations plan budgets and allocate resources efficiently.
Integrating Sales, HR, and Finance Data

One of the most powerful benefits of MIS reporting is the ability to combine insights from multiple departments.
When sales, HR, and finance data are integrated into a unified reporting structure, organizations gain a more complete view of business performance.
For example:
- increasing sales may require additional employees
- hiring new staff affects payroll expenses
- higher expenses impact profit margins
If departments operate independently, these relationships may not be visible.
However, integrated MIS reports allow management to see how different functions influence each other.
This type of reporting improves strategic planning and ensures that decisions are based on accurate data.
MIS Report Comparison by Department
Tools Used to Create MIS Reports
Several tools can be used to design MIS reports depending on the size and complexity of the organization.
Some of the most commonly used tools include:
Microsoft Excel
Excel remains one of the most popular tools for MIS reporting because it offers powerful features such as:
- pivot tables
- formulas and functions
- charts and graphs
- data filtering
Excel is especially useful for small and medium-sized businesses. You can explore more features and documentation on the official Microsoft Excel website.
Microsoft Excel is widely used for creating MIS reports because it offers powerful features like pivot tables, formulas, and data visualization.
If you are new to Excel reporting, you should also learn How I Convert Raw Data into Professional MIS Reports.
SQL Databases
Large organizations often store data in databases. SQL helps extract and analyze this data efficiently.
Key Features of SQL
- Fast Data Retrieval
SQL allows users to quickly extract specific information from large databases using simple queries like SELECT and WHERE. - Joining Multiple Tables
SQL can combine data from different tables using JOIN operations, which helps analysts work with related data stored across multiple tables. - Data Aggregation and Calculations
SQL provides powerful functions such as SUM, COUNT, AVG, MIN, and MAX to perform calculations and generate useful business insights. - Handling Large Volumes of Data
SQL can efficiently process and analyze large datasets, making it ideal for organizations that store thousands or even millions of records.
With SQL queries, professionals can quickly retrieve specific information from large databases without manually searching through thousands of records.
For example, a data analyst can use SQL to find monthly sales data, identify top-performing products, or analyze customer purchase patterns.
Because of these capabilities, SQL plays an important role in MIS reporting and data analysis, especially in large organizations where data is stored across multiple systems.
If you want to understand SQL queries in more detail, you can also explore the official SQL tutorial by W3Schools, which provides beginner-friendly explanations.
Power BI
Power BI is widely used for creating interactive dashboards and visual reports.
It allows businesses to convert raw data into meaningful insights using charts, graphs, and dynamic visualizations.
One of the biggest advantages of Power BI is its ability to connect with multiple data sources such as Excel files, SQL databases, cloud platforms, and ERP systems. This means organizations can combine data from different departments and view everything in one place.
You can learn more about how Power BI works from the official Microsoft Power BI documentation. I’ve already covered a detailed guide on how to become a Power BI Developer, which you can read to learn the required skills, career path, and growth opportunities.
ERP Systems
Enterprise resource planning systems integrate data from different departments into a centralized system.
Each tool plays an important role in building an efficient reporting structure.
Best Practices for Designing MIS Reports
Designing MIS reports effectively requires careful planning and attention to detail.
Some best practices include:
- keep reports simple and focused
- use consistent formatting
- include only relevant metrics
- ensure data accuracy
- automate reporting processes whenever possible
- use visual charts to improve readability
Following these practices helps ensure that reports remain clear and useful for decision-making.
Common MIS Reporting Mistakes and Fixes
My Final Thoughts
Learning how to design MIS reports is an important skill for professionals working in data management, reporting, and business analysis roles.
Organizations rely heavily on structured data insights to make informed decisions, and well-designed MIS reports provide exactly that.
By combining information from sales, HR, and finance departments, businesses can gain a clearer understanding of their performance and identify opportunities for improvement.
The key to effective MIS reporting is simplicity, accuracy, and consistency.
Instead of creating complex reports filled with unnecessary data, focus on meaningful metrics that help management understand what is happening within the organization.
With the right approach and tools such as Excel, SQL, or Power BI, anyone can build structured MIS reports that support better decision-making and improve business performance.
Once you understand these steps, it becomes much easier to design MIS reports that provide clear insights for sales, HR, and finance teams.
Want to Create Better MIS Reports Faster?
Start with Excel, practice real department-wise reporting, and then expand your skills with SQL and Power BI to become more valuable in MIS and data roles.
Frequently Asked Questions
Clear answers to the most common questions about designing MIS reports in Excel for Sales, HR, and Finance teams.
What is an MIS report in Excel?
An MIS report in Excel is a structured report used to track business performance through tables, formulas, charts, and dashboards. It helps managers analyze data and make better decisions.
How do I design an MIS report step by step?
Start by defining the report objective, collecting clean data, organizing it into structured tables, selecting key KPIs, adding charts, building a summary dashboard, and reviewing the report regularly for accuracy.
Which Excel tools are best for MIS reporting?
Pivot Tables, SUMIFS, COUNTIFS, XLOOKUP, IF formulas, Conditional Formatting, charts, slicers, and Power Query are among the most useful Excel tools for creating MIS reports.
What should a sales MIS report include?
A sales MIS report should include daily sales, monthly revenue trends, target vs achievement, regional performance, product performance, and customer growth metrics.
What metrics are important in HR MIS reports?
Important HR MIS metrics include attendance, attrition rate, recruitment status, payroll summaries, training progress, and employee performance data.
Why are finance MIS reports important?
Finance MIS reports help businesses monitor revenue, expenses, profit margins, budget variance, and cash flow so management can control costs and improve profitability.

11 Comments